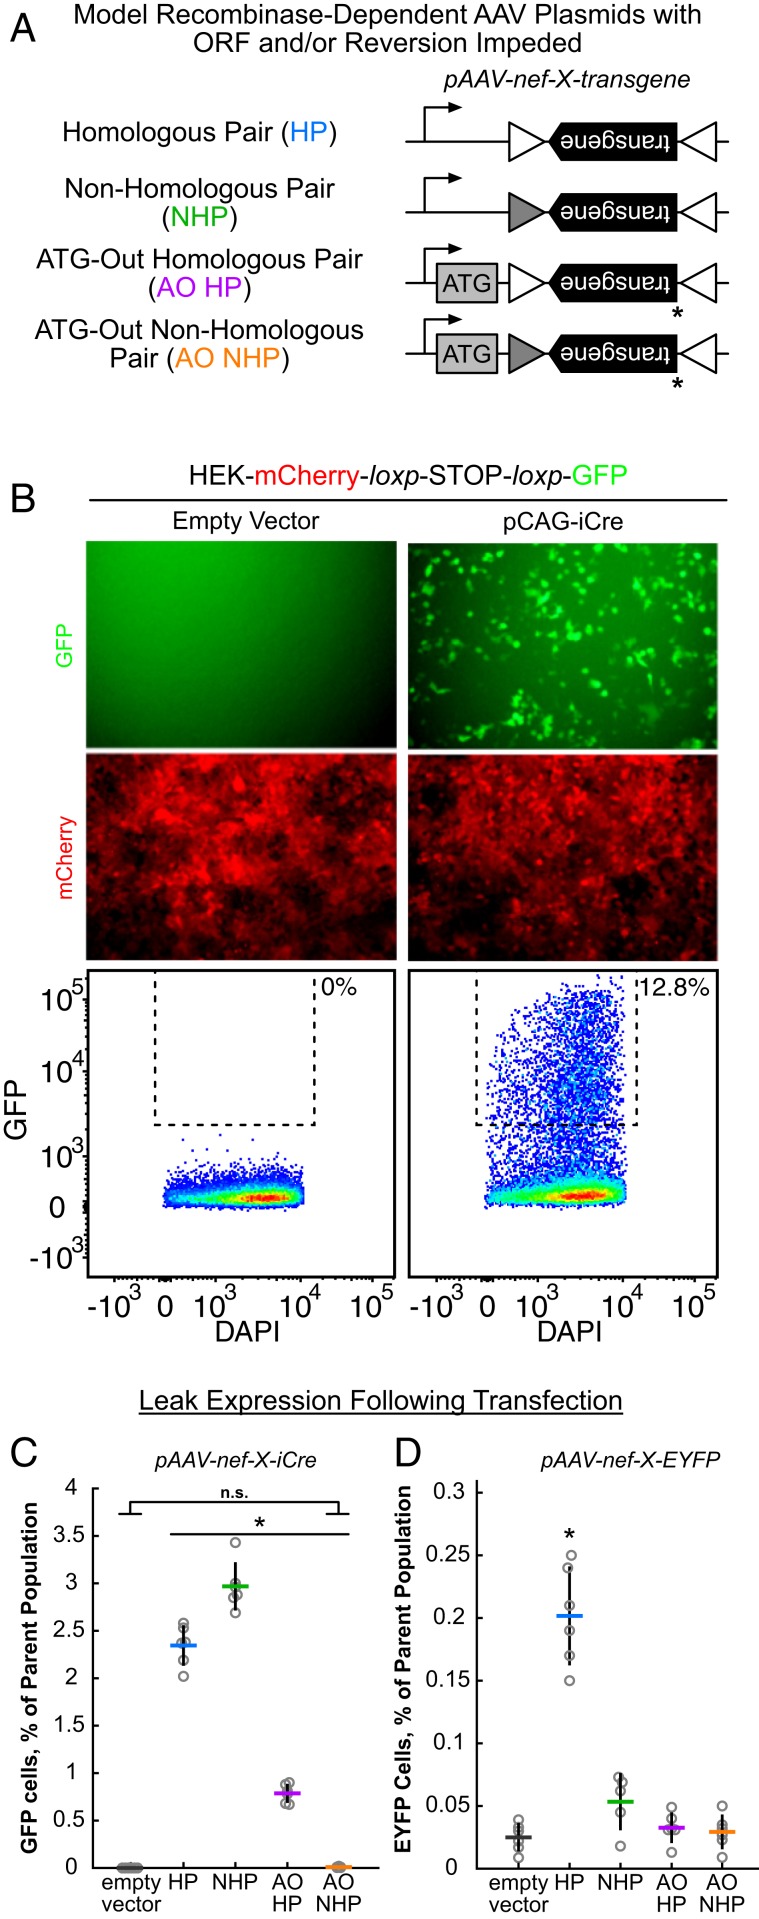
Fig. 3.
Disruption of both transgene ORF and spontaneous reversion are required to abolish leak expression. (A) Schematic of model AAV plasmid constructs designed to disrupt transgene ORF (AO plasmids) or reversion by recombination (NHP plasmids). Triangles denote 34-bp shuffled loxp sites; shadings denote heterologous sequences. Asterisks denote the removal of the ATG start codon from the ORF of the transgene. (B) The HEK293T line constitutively expressing mCherry and GFP under Cre control reports Cre expression. Example images show GFP (Top row) and RFP (Bottom row) channels of images of cell monolayers transfected 48 h earlier with the plasmids listed above. Example flow cytometry results showing degree of Cre leak in HEK-mcherry- loxp-STOP-loxp-GFP cells across Cre-expressing plasmids 48 h after transfection. Controls (Left column) show example GFP signal in empty vector and iCre transfection conditions. Dotted line denotes gate bounding GFP+ cells without any cells falling within it in empty vector condition. Percentages at the Upper Right of the doted gate signify percent of the total shown cell population contained within the gate. (C) Summary of leak expression from iCre plasmids in HEK-mCherry-loxp-STOP-loxp-GFP cells across conditions as measured by percent of cells falling within the dotted gate. Horizontal lines signify mean value across transfections (n = 6, circles) and vertical lines are SD. The AO NHP condition is significantly different (P < 4 × 10⁻⁸, 1-way ANOVA, Tukey–Kramer post hoc multiple comparison) when compared with other modified plasmid conditions (asterisk). No significance (n.s.) was found between AO NHP condition and empty plasmid. (D) Summary of leak from EYFP plasmids in HEK293T cells across conditions as measured by percent of cells falling within the dotted gate. EYFP positive control was omitted to maintain scale. Horizontal lines signify mean value across transfections (n = 6 transfections, except for NHS in which n = 5; circles) and vertical lines are SD. The HP condition is significantly different (P < 1.5 × 10⁻⁸, 1-way ANOVA, Tukey–Kramer post hoc multiple comparison) when compared to other conditions (asterisk).

