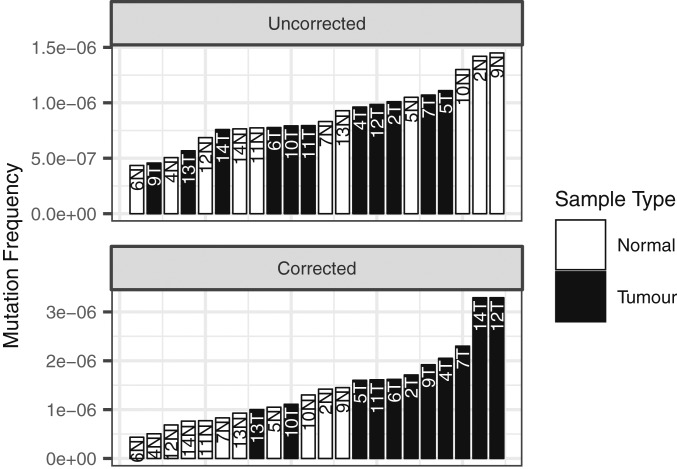
Fig. 1.
Mutation frequencies in CRCs before and after correction for the presence of normal cells. (Top) Mutation frequencies in tumor (uncorrected) and paired normal tissues obtained at a distance 1 cm from the tumor margin. Tumor and normal tissue are not significantly different by Wilcoxon rank sum test, P = 0.84. Conservative, lower tumor mutation frequencies from this figure are reported in the manuscript. (Bottom) Mutation frequencies in tumor (corrected) and paired normal tissues. Tumor mutation frequency corrected for admixture with normal tissue. Percent normal tissue in tumor samples estimated with an automated image analysis system (SI Appendix). Tumor and normal significantly different by Wilcoxon rank sum test, P = 7.0 × 10⁻⁵.

