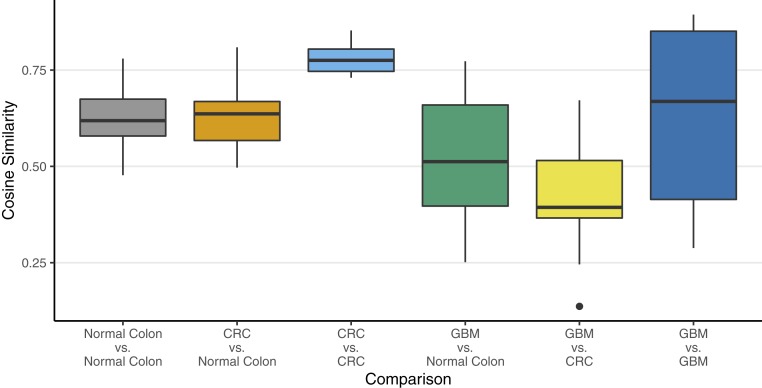
Fig. 2.
Plot of cosine similarities of mutation signatures, grouped by type of comparison. These results show that there is a significant difference between a CRC tumor sample and a glioblastoma multiforme (GBM) sample. Detailed results of an ANOVA of these data are discussed in SI Appendix, Table S6.

