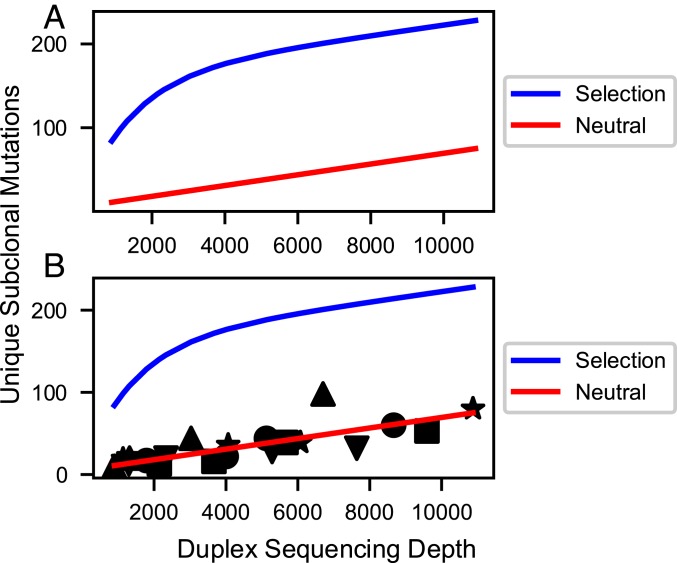
Fig. 3.
Simulated (A) and actual (B) curves for the number of nucleotide sites uniquely mutated in the DNA polymerase library (10 kb) vs. DS depth. (A) Simulations assume most subclonal mutations are neutral passenger mutations (red line) or assume significant purifying selection (blue line). Simulation methods and parameters are given in SI Appendix. Neutral model: The curve for neutral mutations alone is predicted to be approximately linear for sequencing depths up to 100,000 and after that to approach saturation in an exponential fashion. A mathematical transformation of the number of mutated sites, which is predicted to be exactly linear for all sequencing depths, is given in SI Appendix. Selection model (blue line): This curve is the sum of curves for 3 classes of sites (positively selected, neutral, and negatively selected) exponentially approaching saturation of their respective sites at different rates. Positively selected sites approach saturation rapidly, while negatively selected sites approach saturation slowly, if at all. The resulting simulation shows sharp curvature. The figure is only illustrative; the curvature shown may not be detectable for weak selection (s < 0.2) combined with low mutation rate, or for a small number of positively selected sites (<1%). (B) Observed data superimposed on the selected and neutral models from A. The observed data fit the latter neutral model with correlation coefficients ranging from 0.953 to 0.999 for 5 tumors (shape-coded) independently sequenced at multiple depths (SI Appendix, Table S3 and Fig. S1). The plotted line is the optimal regression line through all of the data points from the 5 tumors, less precise than individual regressions for each tumor.

