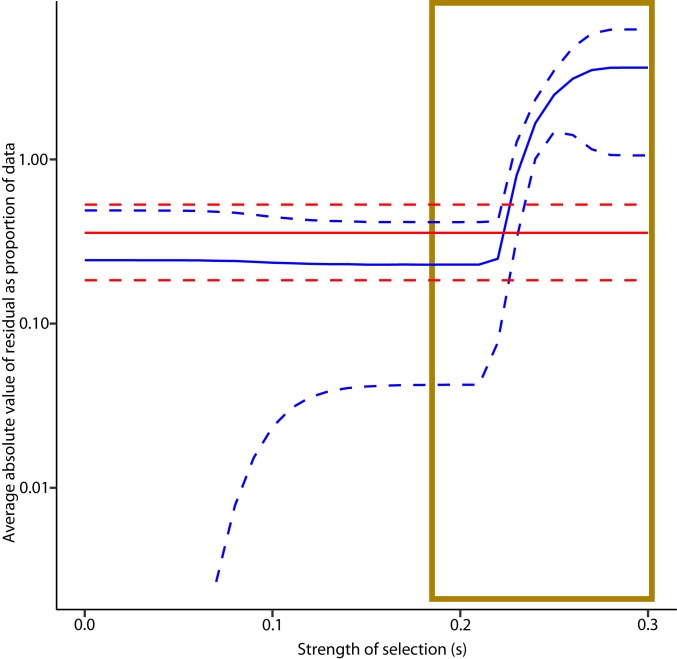
Fig. 4.
Sensitivity threshold for ruling out selection models. Average absolute fractional residual curves for best fit neutral (red) and selection (blue) models are plotted (solid lines) along with their 95% confidence limits (dashed lines) as a function of the strength of selection s. Reference data were 1 of the 5 fresh frozen CRC tumors that we sequenced at multiple depths, plotted according to the approach in SI Appendix, Methods, with the natural logarithm of the unmutated fraction of the capture set plotted against depth. For the selection model, a1 was set at 0.015, indicating 1.5% of loci were positively selected (97% were neutral and 1.5% negatively selected). For each model, kmut-eff and the y intercept value (theoretically zero) were varied in a search for the optimal fit. kmut-eff was constrained to be ≥10−10. For each point in the data, absolute values of the residual as a fraction of the data point itself were recorded. These values were averaged across the data points for each model. For s > 0.23, the average absolute fractional residual is greater than the upper 95% confidence limit of the same statistic for the neutral model, suggesting that this strength of selection is ruled out. Strong drivers typically have s on the order of 1–4 (37). See SI Appendix, Methods, for details of simulation.

