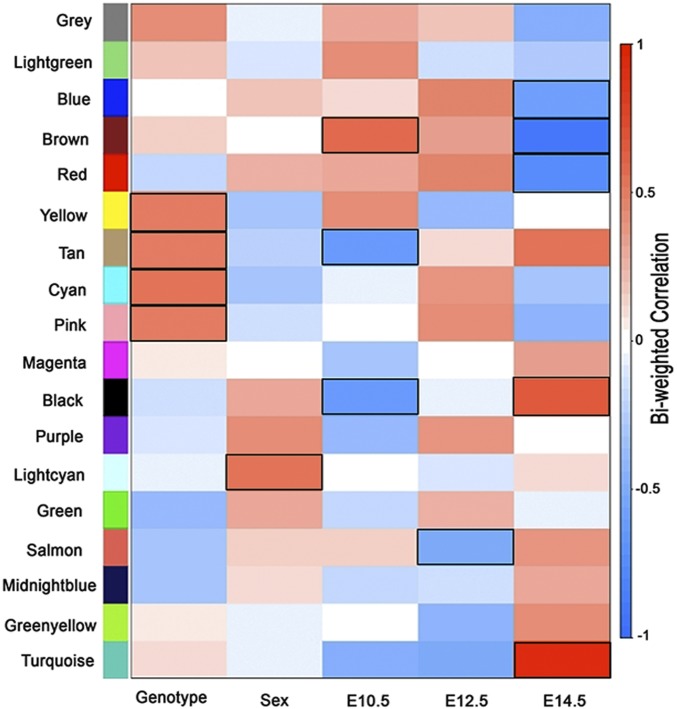
Fig. 2.
WGCNA. A correlation matrix using biweight midcorrelation in WGCNA between 18 modules constructed from all expressed genes from 36 different conditions (3 time points, 2 sexes, 2 genotypes, 3 replicates). At a Bonferroni correction threshold adjusting for 18 modules (P < 0.00277), the lightcyan module was found to be associated with sex (P = 0.001), and the tan (P = 0.0015), cyan (P = 0.0007), yellow (P = 0.0026), and pink (P = 0.0027) modules were found to be associated with genotype. The tan (P = 6.18 × 10⁻⁵), black (P = 9.7 × 10⁻⁵), and brown (P = 0.0002) modules were associated with gene expression at E10.5 as compared to other time points. At E14.5, turquoise (P = 5.2 × 10⁻¹⁶), brown (P = 4.6 × 10⁻¹⁵), red (P = 8.8 × 10⁻⁸), black (P = 1.4 × 10⁻⁵), and blue (P = 2.7 × 10⁻⁴) modules were associated in comparison to other time points; salmon (P = 0.0022, 62 genes) was associated with E12.5 only. All of the associated module for each condition has been highlighted.

