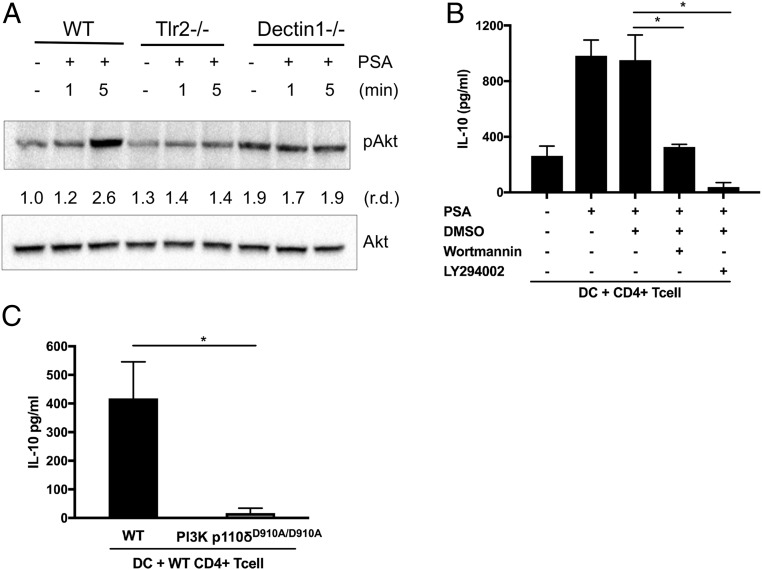
Fig. 3.
PSA signaling leads to activation of the PI3K pathway. (A) Activation of the PI3K pathway was detected by phospho-Akt blotting in macrophages at different time points after PSA stimulation. (B) PSA-induced IL-10 liberation from CD4+ T cells cocultured with splenic DCs. IL-10 levels were measured by ELISA of culture supernatants of splenic DCs cocultured with CD4+ T cells for 5 d in the presence of anti-CD3 and the PI3K inhibitors Wortmannin and LY294002. Cocultures were either treated or not treated with PSA (50 μg/mL). These data are representative of 2 independent experiments. (C) Splenic DCs isolated from either WT or PI3K p110δD910A/D910A animals were cocultured with splenic WT CD4+ T cells and treated with PSA (50 μg/mL). IL-10 levels were measured by ELISA and normalized by subtracting the medium control. Data represent the average of 2 experiments. In B and C, error bars indicate SD values. Scores were assessed for statistical significance by t test. *P < 0.05.

