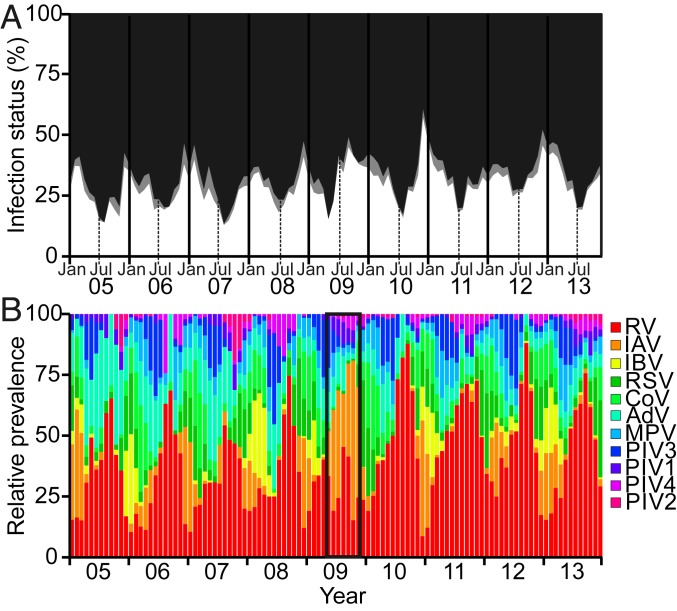
Fig. 1.
Temporal patterns of viral respiratory infections detected among patients in Glasgow, United Kingdom, 2005 to 2013. (A) Percentage of patients diagnosed with a single viral infection (white), a viral coinfection (gray), or determined to be virus-negative (black) by multiplex RT-PCR in each calendar month from 2005 to 2013 (6-mo intervals depicted by vertical lines; Jan = January, Jul = July). (B) Relative virus prevalences in each calendar month, from 2005 to 2013; note total virus counts may sum to more than those informing single infection prevalences due to coinfections, and test frequency denominators vary slightly across viruses. During the first wave of the United Kingdom’s influenza A pandemic [A(H1N1)pdm09] in 2009, infections with influenza A virus were relatively more prevalent among the patient population than noninfluenza virus infections (highlighted by black box). RV = rhinoviruses (A–C); IAV = influenza A virus (H1N1 and H3N2); IBV = influenza B virus; RSV = respiratory syncytial virus; CoV = human coronaviruses (229E, NL63, HKU1); AdV = human adenoviruses; MPV = human metapneumovirus; PIV3 = parainfluenza 3 virus; PIV1 = parainfluenza 1 virus; PIV4 = parainfluenza 4 virus; PIV2 = parainfluenza 2 virus. See also Table 1. Virus groups are listed in descending order of their total prevalence.

