Fig. 4.
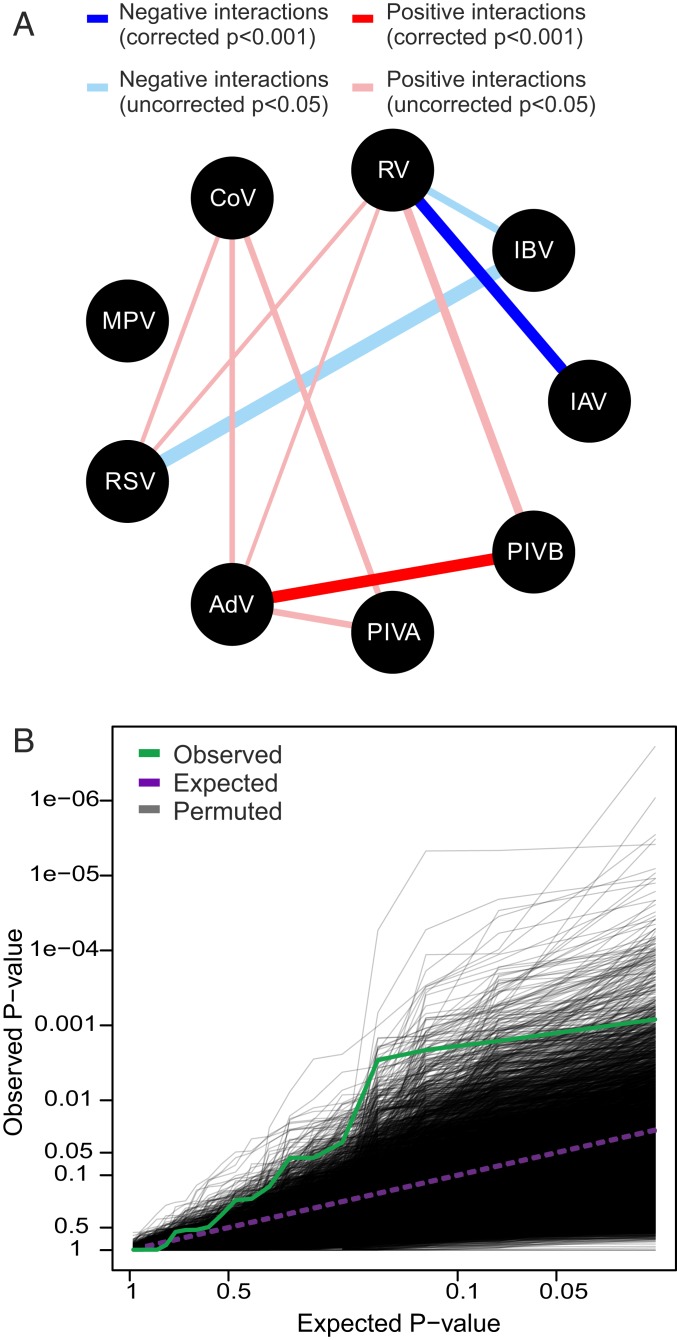
Host-scale interactions among influenza and noninfluenza viruses. (A) Statistically supported negative (OR < 1) and positive (OR > 1) virus–virus interactions based on uncorrected P < 0.05 from multivariable logistic regression analysis. Line widths are proportional to the absolute value of the maximum log OR estimated per virus pair. Two interactions (RV/IAV and AdV/PIVB) retained strong statistical support (P < 0.001) following Holm’s correction to control the familywise error rate. (B) Test of the global null hypothesis: QQ plot of the observed P value distribution from 20 pairwise tests among the 5 remaining virus groups (IBV, CoV, MPV, RSV, and PIVA; green line), compared to the P value distribution expected under the global null hypothesis of no interactions (purple dashed line). The distribution of QQ lines simulated from the global null hypothesis using 10,000 permutations is shown in gray. See Table 1 for a full description of the viruses. Due to comparatively low infection frequencies, parainfluenza viruses were regrouped into PIVA (PIV1 and PIV3; human respiroviruses) and PIVB (PIV2 and PIV4; human rubulaviruses).

