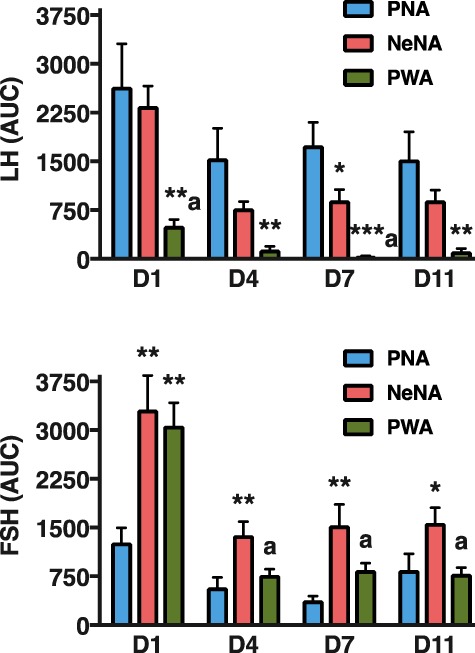
Figure 5.

Integral gonadotrophin responses to KP-54 in the three preclinical rat models of PCOS. Integral LH (upper panel) and FSH (lower panel) responses to KP-54 administration are presented from the three preclinical models of PCOS (PNA, NeNA and PWA; N = 10 per model) at adulthood. Integral responses were calculated as AUC over the 240-min period following KP-54 administration, for each indicated day of treatment. Data in these graphs are the AUC values of the hormonal profiles presented in Figs 3 and 4. Data are presented as the mean ± SEM. Data were analyzed by ANOVA followed by Student–Newman–Keuls tests (**P < 0.01 versus corresponding PNA values; aP < 0.01 versus corresponding NeNA values).
