Figure 1.

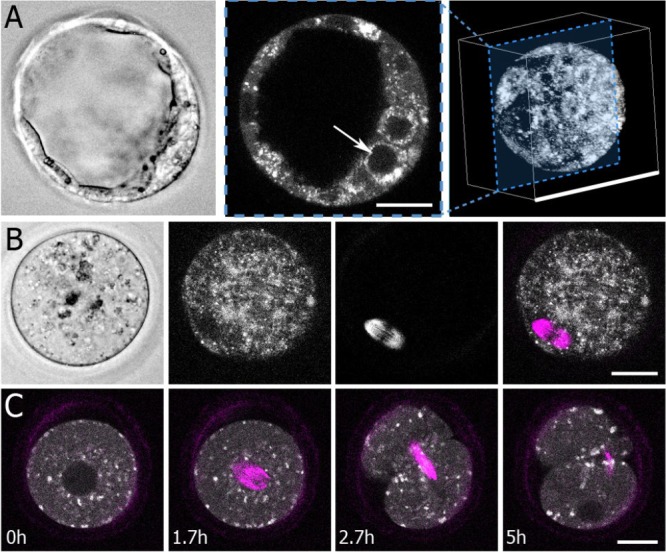
Morphological features imaged with fluorescence lifetime imaging microscopy and second harmonic generation imaging. (A) Left: a standard bright-field image of a mouse blastocyst shows gross morphological features. Middle: fluorescence lifetime imaging microscopy (FLIM) measurements of nicotinamide adenine dinucleotide (NADH) generate intensity images that visualize subcellular structures, including nuclei (white arrow, 25-μm scale bar). Right: 3D reconstruction from multiple focal planes (100-μm scale bar). (B) Left: Bright-field image of an oocyte. Second to left: a flavin adenine dinucleotide (FAD) FLIM image of the same oocyte. Second to right: a second harmonic generation (SHG) image of the same oocyte, which clearly shows the oocyte’s spindle. Right: Overlay image of SHG (magenta) and FAD (grey scale) (25-μm scale bar). (C) Time lapse FLIM (NADH) and spindle measurements capture key embryo dynamics, such as cell division (25-μm scale bar).
