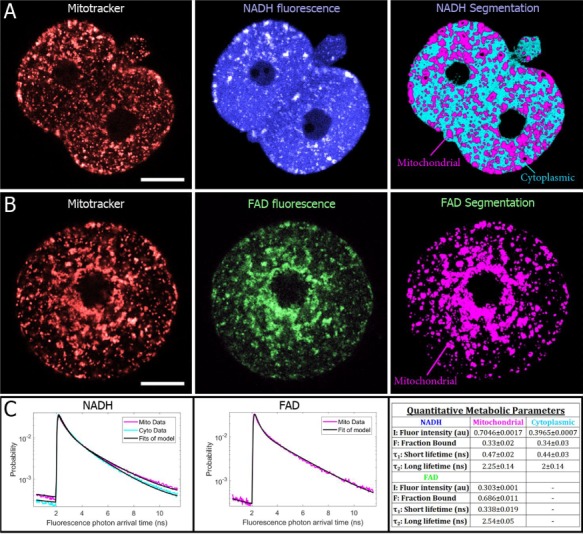
Figure 2.

FLIM allows for mitochondrial imaging and separate segmentation of mitochondrial and cytoplasmic signals. (A) MitoTracker images (left) of a two-cell embryo shows co-localization with brighter regions of NADH (center) (25-μm scale bars). A machine-learning-based algorithm performed on autofluorescence images successfully segments mitochondria and cytoplasm (right). (B) MitoTracker and FAD autofluoresence images of a one-cell embryo also show co-localization. For FAD images, only mitochondrial regions were segmented. (C) For each region, all photon arrival times were binned into a separate histogram, which were normalized to produce a probability distribution, which represents the probability of being in an excited state after excitation. Fitting these curves to a two-exponential decay model produces a total of 12 parameters for characterizing the metabolic state of an embryo or oocyte (right).
