Figure 3.

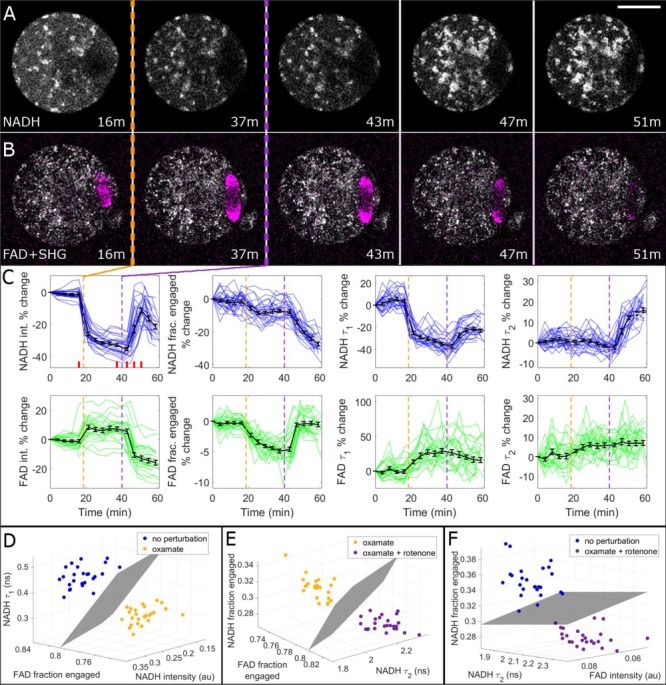
Metabolic and SHG imaging of oocytes detects effects of metabolic perturbations. Oocytes were exposed to 10 mM oxamate and then to 1 μM rotenone. (A) Oxamate exposure (indicated with a dashed orange line) caused a visible drop in cytosolic NADH FLIM intensity, whereas rotenone exposure (purple line) caused an increase in mitochondrial NADH intensity. Bar is 30 μm. (B) For the same oocyte, oxamate slightly increased FAD intensity, while rotenone decreased it. Simultaneous SHG imaging, overlaid in magenta, revealed that spindles were not disrupted by oxamate, but were disintegrated by rotenone. (C) Percentage-change time courses for all eight metabolic parameters. Colored traces represent individual oocyte trajectories (n = 25), and average curves are shown in black with SE bars. Vertical dashed lines indicate oxamate (orange) and rotenone (purple) exposures. Red bars in the NADH intensity panel correspond to the time stamps of the images shown in (A) and (B). (D) FLIM parameters were compared before and after oxamate exposure, and the three FLIM parameters with the largest separation were plotted on 3D plots, yielding complete separation. This comparison was also performed for (E) oxamate versus oxamate + rotenone, and (F) no perturbation versus oxamate + rotenone.
