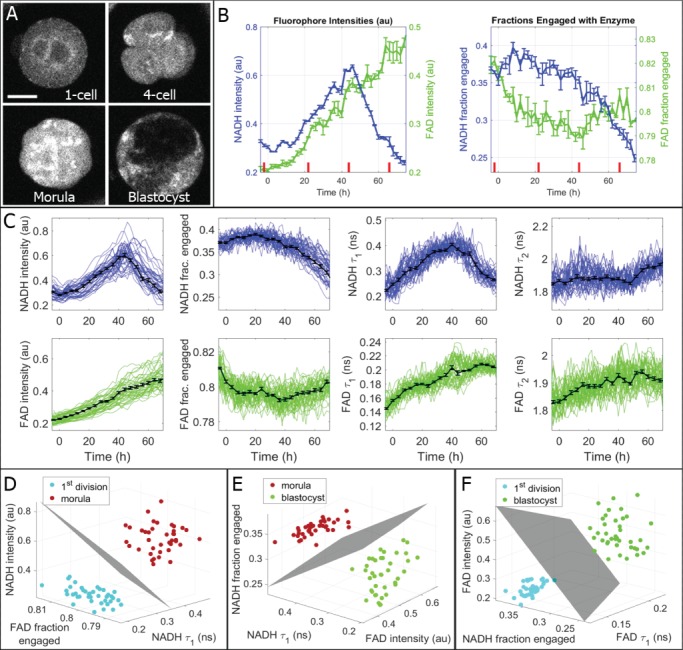
Figure 4.

High time-resolution measurements of metabolic state during mouse embryo development. (A) Embryos were imaged together in 9-microwell dishes and individually tracked and analyzed to generate time plots for all FLIM parameters. Bar is 30 μm. (B) Time plots for NADH and FAD intensities and fractions engaged for the individual embryo shown in (A). Distinct changes are evident in multiple parameters, especially around the onset of blastocyst formation (~44 h after the 1st division, which is represented here as t = 0 h). Corresponding time points for the four images are displayed with red dashes on the plots. (C) The observed trends were robust and reproducible among all healthy embryos. These plots display individual embryo trajectories as thin-colored lines (n = 39), which were synchronized by 1st division. Averaged metabolic curves from all 39 embryos are displayed as thick black lines with SE bars. (D) FLIM parameters were compared between the 1st division and morula stages, and the three FLIM parameters with the largest separation were plotted as 3D plots, yielding complete separation. This comparison was also performed for (E) compaction versus expanded blastocyst and (F) 1st division versus expanded blastocyst.
