
Fig. 3.
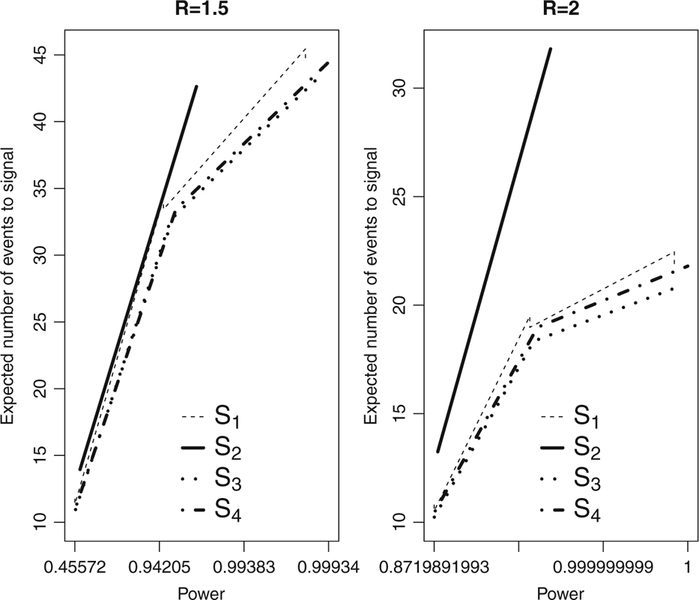
Expected number of events to signal versus power comparing the shapes S1(t) with ρ = 0.5, S2(t), S3(t), and S4(t)with γ = 0.5. Each design is based on the tuning parameters R = 1.5, 2, α = 0.05, and selected maximum length of surveillance T. Note the log-scale for power