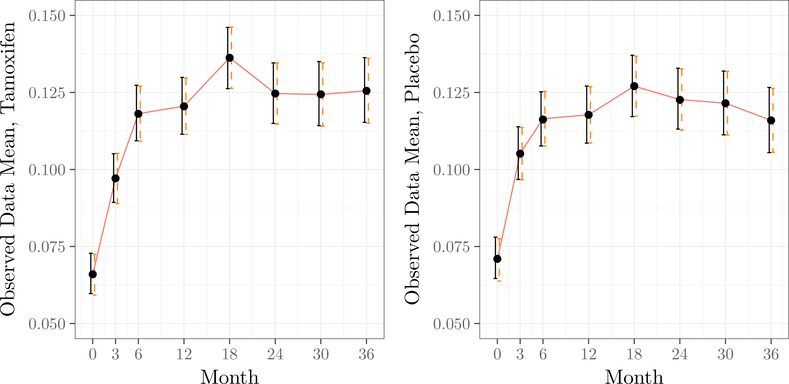
Figure 1:
Observed data means over time for the tamoxifen and placebo arms of the study. Dots correspond to the posterior mean using the prior outlined in this section. The line corresponds to the empirical mean of the observed data for each time point. Solid error bars give the 95% credible interval for the observed data mean; dashed error bars given the usual 95% confidence interval based on asymptotic normality of the observed-data means.

