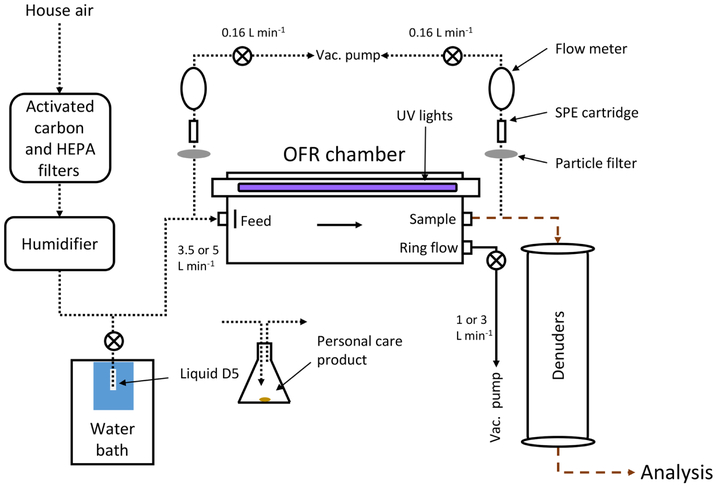
Figure 1.
Flow diagram for generation of aerosols in the OFR. Aerosols were analyzed by SMPS, TPS100, V-TDMA, and DMT-CCN instruments. Delivery of the precursor gas was either by diffusion of liquid D5 controlled by a water bath or flowing air past a personal care product placed in an Erlenmeyer flask. Short dashed lines in the diagram indicate Teflon tubing, long dashed lines represent copper tubing, and solid lines represent conductive silicon tubing.

