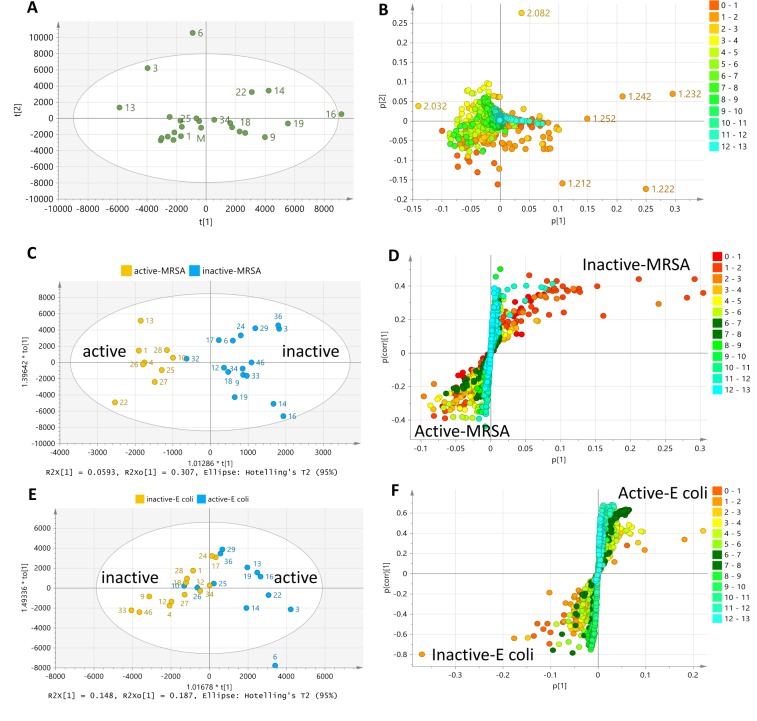
Fig 6. Multivariate analysis of the 1H-NMR chemical shift data in ppm of 25 extracts tested against MRSA and E. coli.
(6A) PCA-scores and (6B) -loadings plot of 25 isolates. OPLS-DA scores plot against MRSA (6C) and E. coli (6E). OPLS-DA loadings S-plot of isolates against MRSA (6D) and E. coli (6F).

