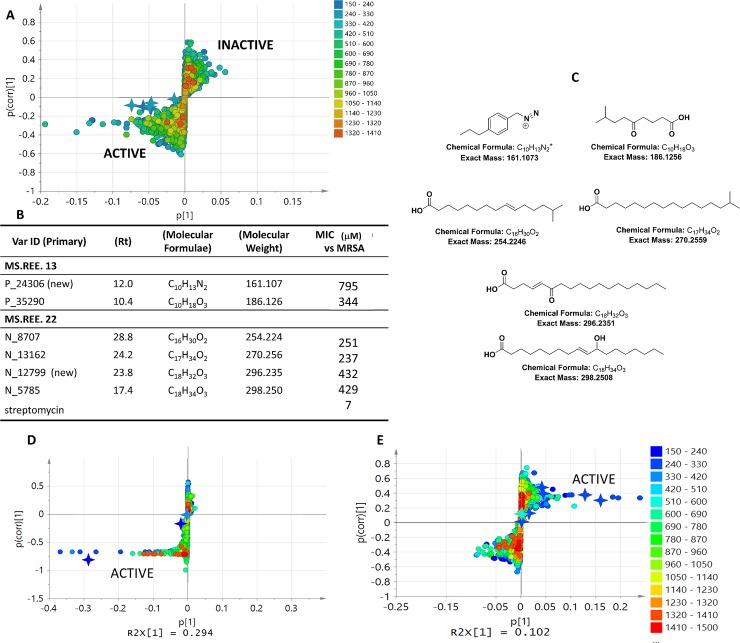
Fig 8. Mapping the targeted and isolated bioactive metabolites on OPLS-DA plots.
(8A) OPLS-DA loadings plot of crude extracts. The isolated compounds are represented by a 4-point star. (8B) Dereplication table and bioassay results against MRSA for the isolated compounds with streptomycin as positive standard. (8C) Structures of the isolated bioactive compounds. (8D) OPLS-DA loadings plot of MS. REE. 13 fractions. (8E) OPLS-DA loadings plot of MS. REE. 22 fractions. Both isolated and the targeted bioactive metabolites were marked with a 4-point star.

