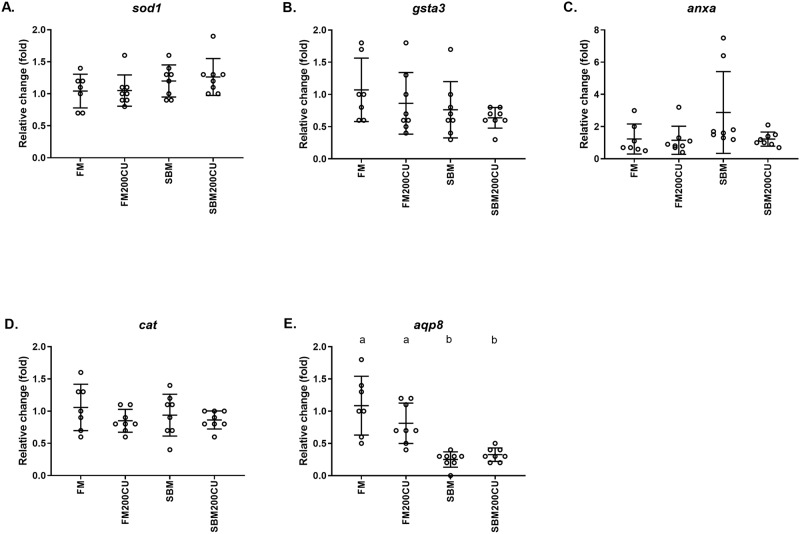
Fig 5. Gene expression.
Quantitative PCR analyses of (A) superoxide dismutase 1 (sod1), (B) glutathione S-transferase alpha 3 (gsta3), (C) annexin (anxa), (D) catalase (cat) and (E) aquaporin 8 (aqp8) genes in the DI of Atlantic salmon fed a control fishmeal-based diet (FM), a diet containing 200 g/kg Candida utilis (FM200CU), and a diet containing 200 g/kg soybean meal (SBM) and one diet with 200 g/kg SBM in combination with 200 g/kg of C. utilis (SBM200CU) for 30 days. Data are mean –ΔΔCT ± SE (n = 7 for FM diet, n = 8 for the other groups). All relative fold changes are calculated in relation to the FM group.

