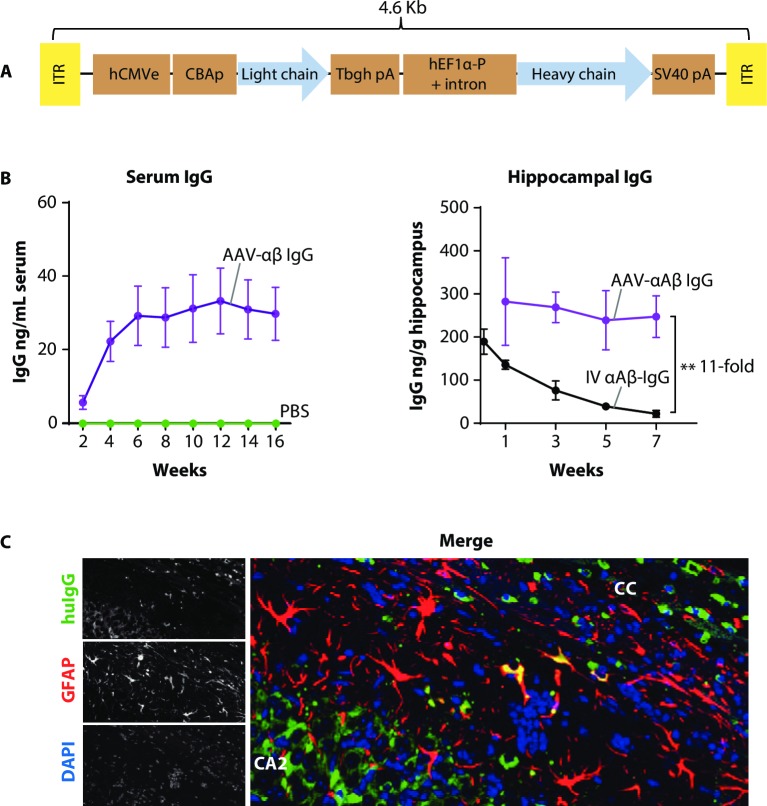
Fig 1. Construction and characterization of an AAV-IgG vector.
A) A schematic of the dual promoter cassette for full heavy and light chain expression. The size of the genome is indicated. B) Graph on left shows durable expression and secretion of AAV-αAβ IgG from the brain. Sera was drawn at 2 week intervals for 16 weeks following bilateral injection of AAV-αAβ IgG into the hippocampus (2E10 GC per side) of SCID mice. Purple line is the AAV-αAβ IgG expression level. Green line is huIgG measured from PBS injected control mice. Graphed points represent the mean +/- SEM, n = 8 mice per group. Graph at right shows the dynamics of AAV-mediated expression of AAV-αAβ IgG in the brain versus traditional peripherally administered αAβ IgG. SCID mice were injected once with 2E10 GC of AAV- αAβ IgG bilaterally into the hippocampus, or once with 20mg/kg IV purified IgG before tissue collection at the indicated times to generate a time course of brain exposure to IgG. Ipsilateral hippocampi were homogenized and assayed for huIgG by antigen ELISA. Graphs show the mean +/- SEM. **p<0.01, 1-way ANOVA at 7 weeks post injection, n = 5 mice per time point. C) Intraneuronal and glial expression of AAV-IgG is detectable in the hippocampus. Micrograph shows neurons expressing the huIgG transgene in neurons throughout the hippocampus (CA2 shown in detail), with some GFAP+ astrocytes nearby also expressing huIgG. Cc = corpus callosum.

