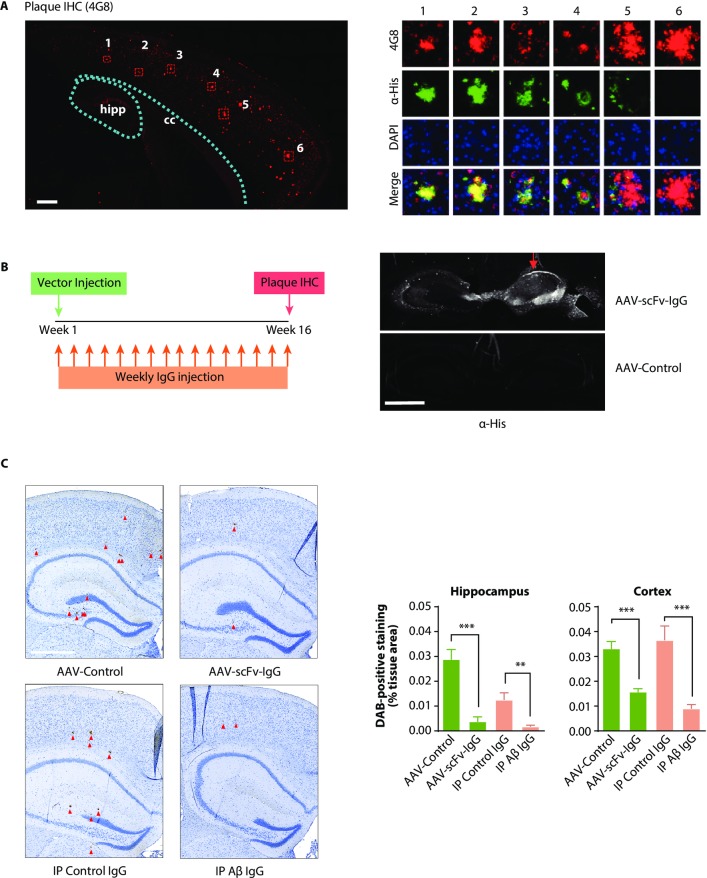
Fig 5. Expression, diffusion, and plaque binding of the anti-Aβ scFv-IgG.
Five month old female APP animals with pre-existing plaque pathology were injected unilaterally with 1μL (1E10 total GC) of AAV-scFv-IgG vector, and 5um sagittal sections of brain were collected 1 month later. A) Whole scan of hippocampus and overlying cortex of 5 month old APP mice 1 month post-injection with anti-Aβ AAV-scFv-IgG. Sections were immunostained for amyloid beta plaques (4G8, red) and 6xHis (green). Scale bar = 300μm. Cc = corpus callosum. Images at right show individual plaque ROIs (numbered in A) proximal (1) to distal (6) from the site of injection. Images were overlaid with 6xHis immunostaining (green) and DAPI (blue). Note the progressive but far reaching reduction in the intensity of 6xHis labeling on plaques that are more distal to the hippocampus and occipital cortical areas of AAV-scFv-IgG expression. ROIs are 150μm in diameter. B) Outline of study design. Four groups of 2 month old APP male mice were injected with either the AAV-scFv-IgG, AAV-Control vector, Aβ IgG, or control isotype IgG. The AAV vectors were injected unilaterally into the hippocampus, while IgGs were injected IP weekly at 10mg/kg for 16 weeks. Brains were collected after 4 months of treatment, and coronal sections of brain were immunostained for amyloid plaques or 6xHis. Images to the right show the hippocampus from coronal sections of AAV-injected mice. Anti-His IHC revealed labeling throughout the hippocampus on the injected side (red arrow), with additional transduction of the contralateral hippocampus. AAV-empty injected brain did not show any anti-His labeling. Scale bar = 1mm. C) Representative images of coronal brain sections immunostained and enlarged to show cortical and hippocampal 4G8+ amyloid plaques (dark brown stain). Both control groups showed clear plaque accumulation in cortex and hippocampus, whereas animals treated with the AAV-scFv-Fc targeting Aβ, or the positive control Aβ IgG had significantly fewer plaques. Plaques are indicated by red arrowheads. The scale bar is 500μm. The graph to the right shows the quantification of plaque deposition in cortex and hippocampus of animals from each respective group. ROIs from both hemispheres were combined for quantification and plaque load is expressed as DAB-positive staining as a percent of tissue ROI area. n = 10–13 animals per group, 3 sections per animal. ***p<0.001 one-way ANOVA with multiple comparisons. Errors bars represent S.E.M.

