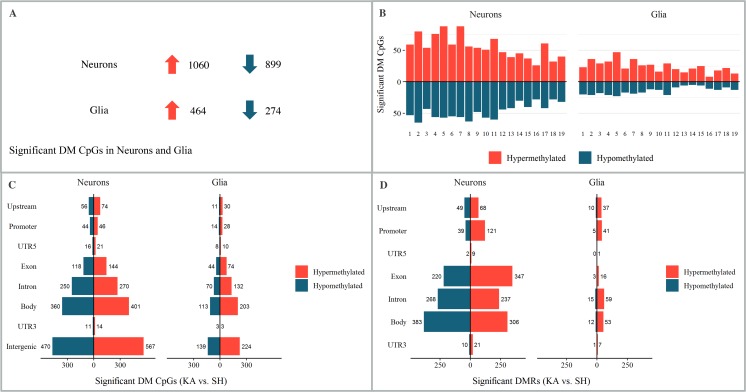
Fig 1. Differential DNA methylation at 24 hours post injection in the intracortical kainic acid model of mTLE.
(A)–(C) Statistical analysis of differentially methylated CpGs (DM CpGs) of KA versus SH group, 24 hours post injection. (A) DM CpGs in neurons and glia; upward arrow indicates hypermethylation and downward arrow hypomethylation of DM CpGs. (B) Chromosomal distribution of DM CpGs. (C) Distribution of DM CpGs amongst genomic features. (D) Distribution of differentially methylated regions (DMR) amongst genomic features.

