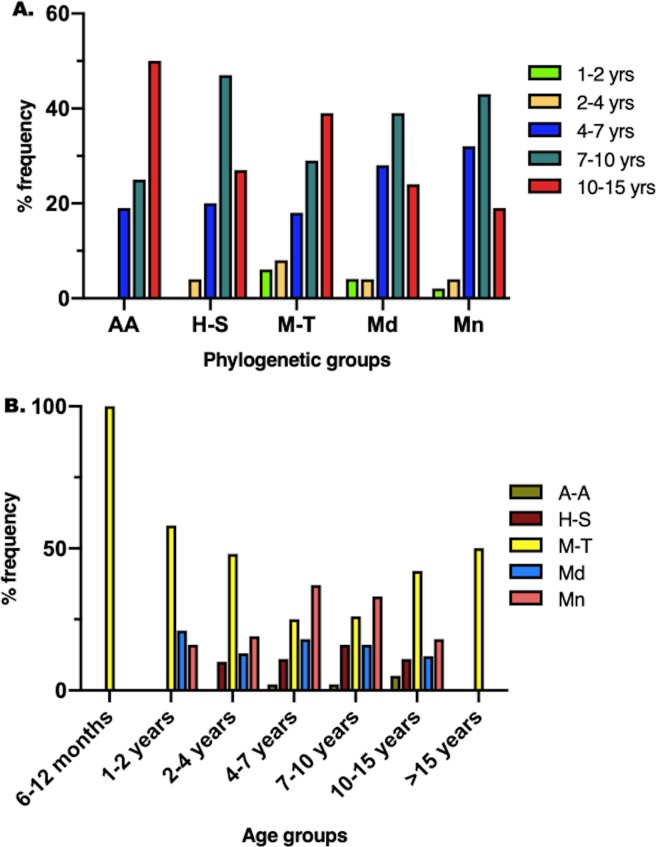
Fig 2.
Bar graphs showing the distribution of: (A) age groups between phylogenetic groups, (B) phylogenetic groups between different age groups. (A) The distribution of age categories was significantly different between the phylogenetic clusters (p = 0.0006). Either the 7–10 years or the 10–15 years category was the most frequently represented in all phylogenetic clusters. The 6–12 months and >15 years age categories each had 1 dog in the M-T cluster, and are not graphically represented. (B) The distribution of phylogenetic clusters was significantly different between age categories (p = 0.0006). The Mn cluster was the most frequently represented cluster among the 4–7 and the 7–10 year old dogs. The M-T cluster was the most frequently represented cluster among all other clusters. A-A = Ancient-Asian; H-T = Herding-Sighthound; M-T = Mastiff-Terrier; Md = Modern; Mn = Mountain.

