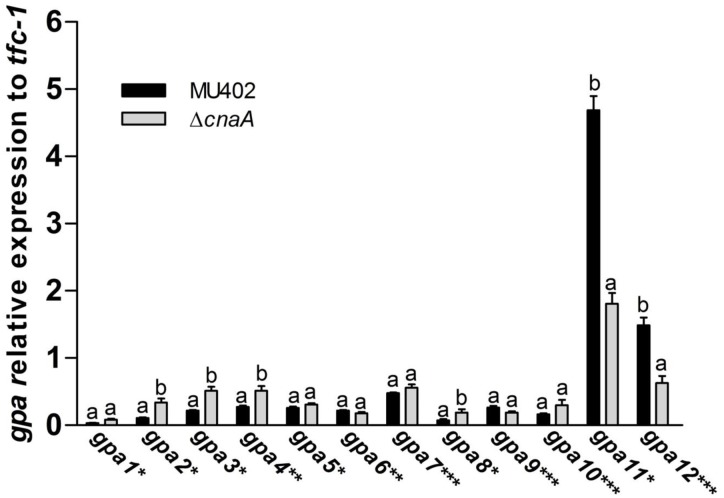
Fig 7. Quantitation of gpa mRNA levels in M. circinelloides ΔcnaA.
Changes in levels of mRNA from different gpa genes from total RNA purified from sporangiospores of wild-type (closed bars) and ΔcnaA (open bars). qRT-PCR was carried out to determine the transcript levels of gpa genes, ΔCt analysis was performed to compare the mRNA levels between the strains. Four independent experiments were performed for each condition. Statistically significant differences are indicated by different letters (ANOVA and Fisher’s tests; p ≤ 0.05).

