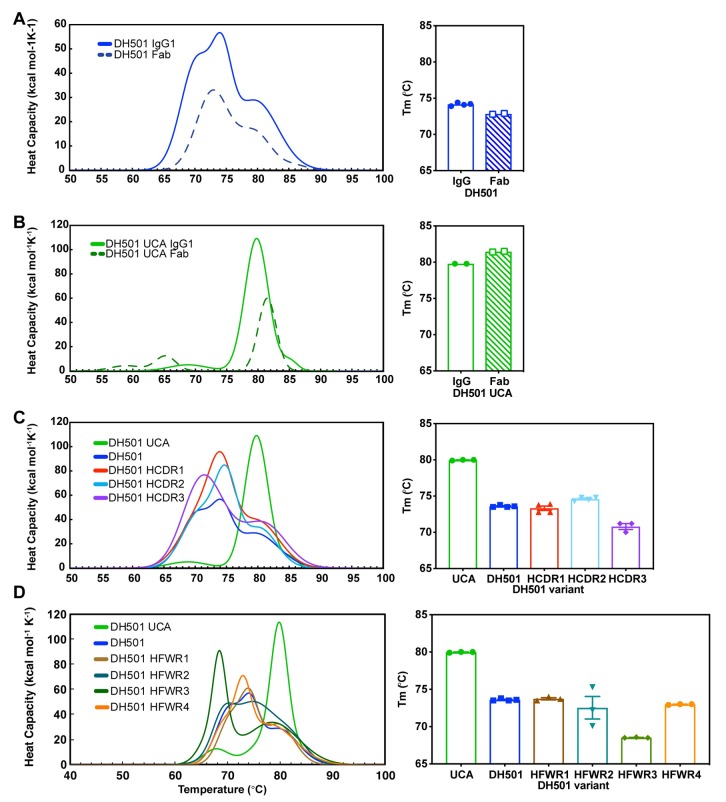
Fig 8. Somatic mutation reduces the thermostability of DH501.
(A, B) The melting temperature (Tm) of (A) DH501 and the (B) DH501 UCA. The Tm of IgG (solid line) and Fab (dashed line) was determined by differential scanning calorimetry. The melting curves (left) show the melting transitions and the Tm for IgG and Fab is shown in the bar graph (right). The bar graph symbols represent the independent measurements with the bar showing the mean of the replicates. (C,D) The melting curves and Tm of (C) HCDR-reverted and (D) HFWR-reverted DH501 IgG antibodies. The bar graph symbols represent independent measurements with the bar showing the mean of the replicates.

