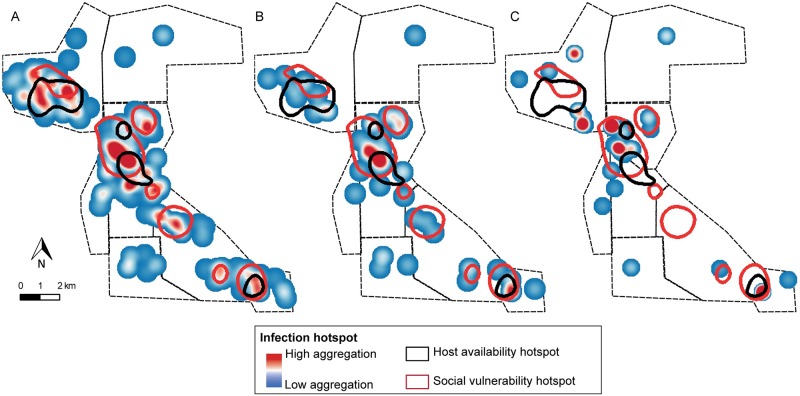
Fig 5. Heatmaps of the household number of T. cruzi-seropositive people (A) and children (B), and the relative abundance of T. cruzi-infected T. infestans per unit of effort (B) in 2008, prior to a community-wide insecticide spraying campaign, Pampa del Indio, Argentina.
The areas of qualitative aggregation (as determined by heatmaps) of social vulnerability and host availability are also shown. The maps were created in QGIS 2.18.11. based on the data collected within the scope of this study (S4 Table).

