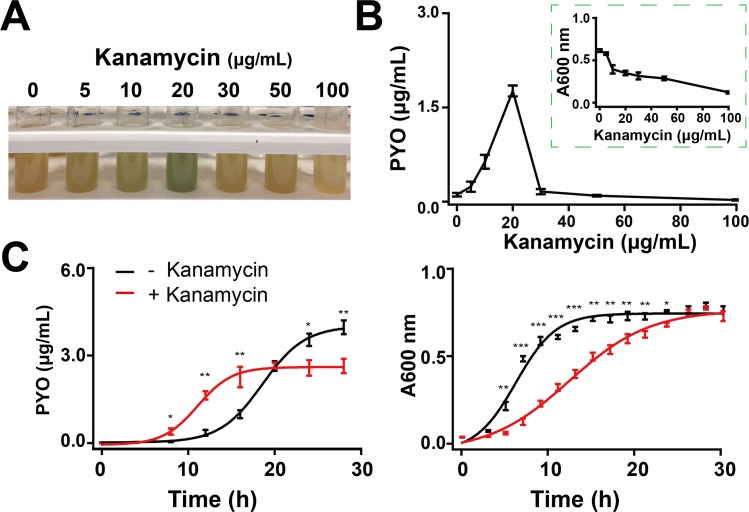
Fig 1. Antibiotics induced accumulation of PYO.
(A) Representative images of Kan-induced color changes in P. aeruginosa PAO1 cultured in LB medium, with shaking of 200 r/min at 37°C. The image of the tubes was taken at 12 h. (B) PYO concentrations and cell densities (A600 nm) of PAO1 in varying concentrations of Kan after incubation in the tubes for 12 h. Regarding A and B, bacteria in the presence and absence of Kan are in the exponential phase and early stationary phase, respectively. (C) Typical dynamics of PYO concentrations (left) and bacterial growth curves (right) of PAO1 treated with 20 μg/mL Kan in the tubes, with shaking of 200 r/min at 37°C. The data underlying this figure can be found in S1 Data. Means ± SD are presented (n = 3). *P < 0.05, **P < 0.01, ***P < 0.001. P values were determined by paired t test. A600 nm, absorbance 600 nm; Kan, kanamycin; LB, Luria-Bertani; PYO, pyocyanin.

