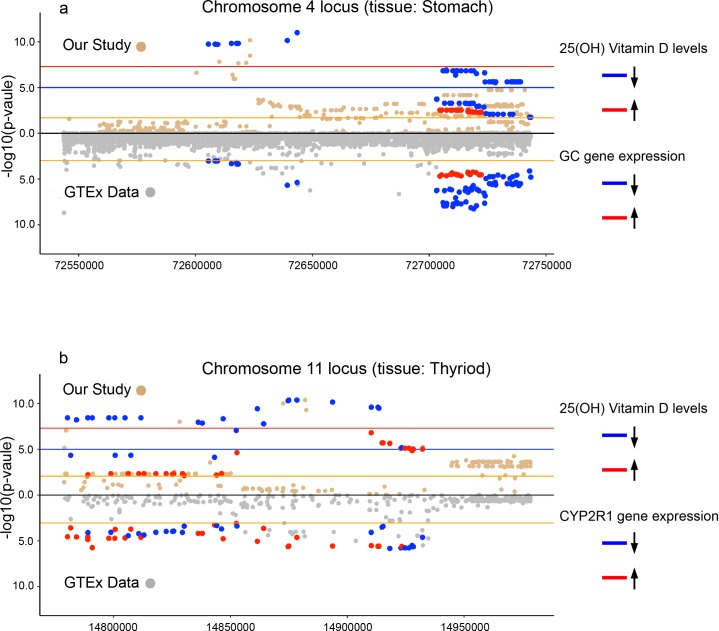
Fig 5. Association statistics for 25(OH)D in 24-month old children vs GTEx expression data.
a) Association statistics for 25(OH)D in 24-month old children within the 200kb target window on chromosome 4 compared to the GTEx eQTL dataset for the tissue ‘Stomach’. All SNPs that both show a significant association statistic and are present in both datasets are colored either blue (-) or red (+), depending on the direction of the SNP’s beta coefficient. As shown in the figure, all significant SNPs present in both datasets have a concordant direction of association. b) Association statistic comparison for SNPs within the target window on chromosome 11, both in our study and in the GTEx dataset for the tissue ‘Thyroid’. Also for the chromosome 11 locus complete concordance in the SNP’s association direction is seen. (red line: genome-wide significance; blue line: genome-wide suggestive significance; orange line: FDR 0.05).

