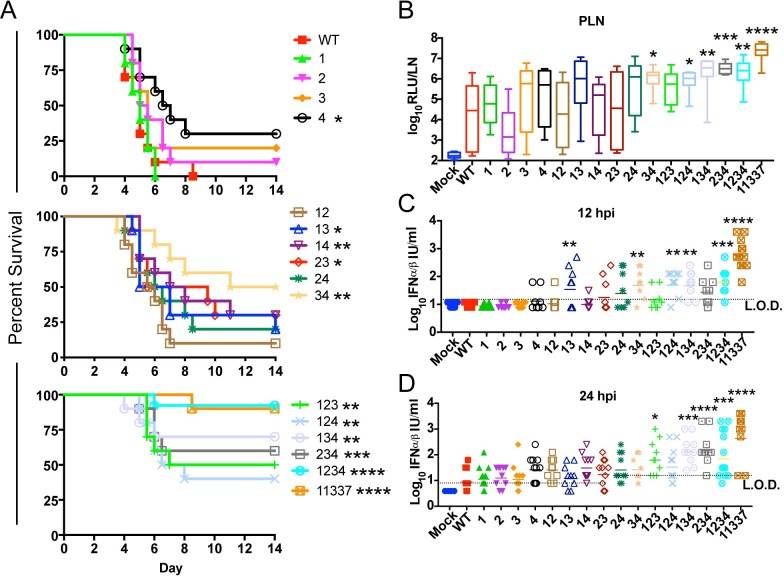
Fig 3. Elimination of miR-142-3p binding sites leads to attenuation due to increased virus replication in popliteal lymph node and serum IFN.
(A) Female outbred CD-1 mice (6 weeks) were infected with 103 pfu sc in each footpad. Morbidity and mortality were measured twice daily. n = 10 mice from 2 independent experiments *P<0.5, **P<0.01, **P<0.001, ****P<0.0001, Log-Rank Test comparing each EEEV mutant to WT. (B) Outbred CD-1 mice were infected with 103 pfu of WT, 11337 or each mutant sc in each footpad. A single popliteal lymph node (PLN) was harvested at 12 hpi and analyzed for nLuc expression. Data is log10 transformed and represented as RLU per LN. n = 7–12 mice, from 2–3 experiments. Box-and whisker plots represent min-max with bar representing the median value. (C-D) Biologically active IFN-α/β levels in serum at 12 hpi (B) and 24 hpi (C). CD-1 mice were infected with 103 pfu of WT, 11337 or each mutant sc in each footpad. n = 8–12 mice, from 2–3 experiments. *P<0.05, **P<0.01, ***P<0.001, ***P<0.0001, comparing the log-transformed data of each mutant with WT using the one way analysis of variance test with corrections for multiple comparisons using the Holm-Sidak method. LOD = limit of detection of the IFN assay. Bar represents geometric mean.

