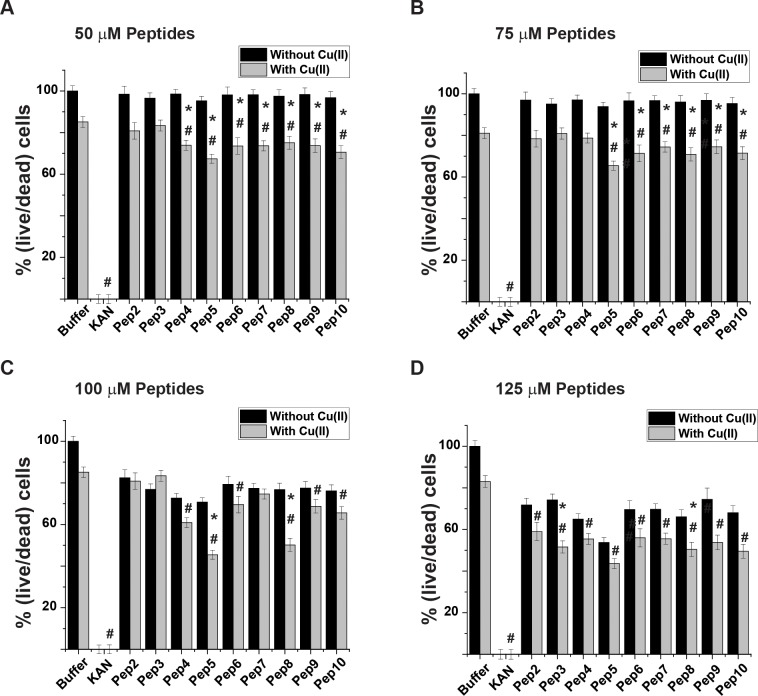
Fig 4. Effect of the test peptides on E. coli viability.
E. coli cultures were grown as described in Methods. After 14 h, test peptides were introduced to the medium in the presence (gray bars) and absence (black bars) of Cu(II). Concentrations of the test peptides: A. 50 μM, B. 75 μM, C. 100 μM, and D. 125 μM. *p < 0.05, MEAN ± SE, n = 3, a comparison between the values in the presence and absence of Cu(II). #p < 0.05, MEAN ± SE, n = 3, in the presence of Cu(II) and comparing between values of a buffer and peptide. t-test was used for the statistic evaluation.

