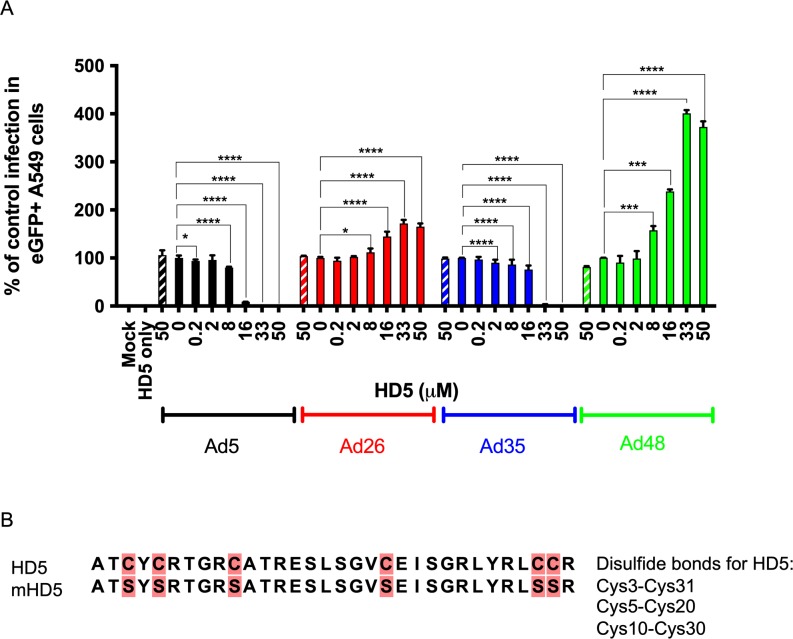
Fig 1. Analysis of adenovirus sensitivity to HD5 in A549 cells.
Ad5, Ad26, Ad35, and Ad48 were incubated with 0.2 μM– 50 μM HD5 or 50 μM mutant HD5 (diagonal box) and assessed for % of cells expressing eGFP 24 h post infection. Experimental results are normalized to control infected with virus (100%) in the absence of peptide. (B) HD5 and mHD5 amino acid sequence alignment. Cysteine → Serine mutations are highlighted in pink. Data is expressed as the mean (±SD) of three independent experiments. **** p < 0.0001, *** p < 0.001, ** p < 0.01, * p < 0.05, one-way ANOVA test (compared to virus only control).

