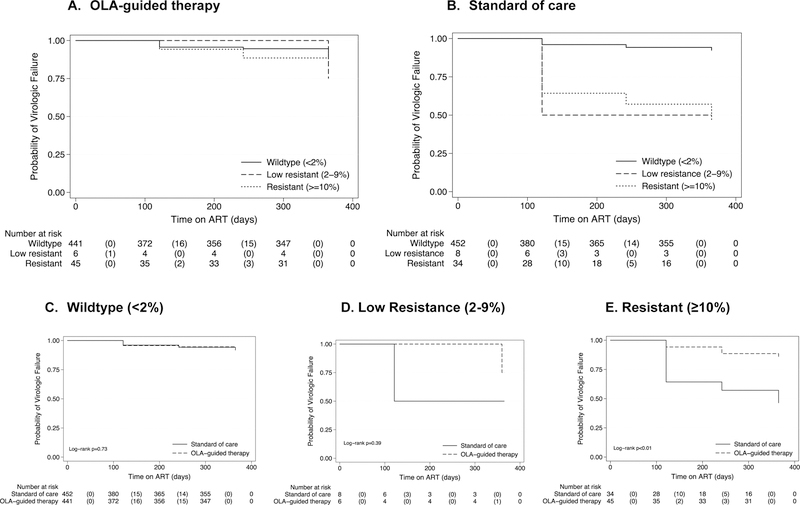
Figure 4:
Kaplan Meier curves of time to virologic failure (≥400 copies/µL) in the OLA-Guided Therapy (a) and SOC participants (b) by HIV drug-resistance mutation frequency, and drug resistance mutation frequencies by arm (c-e)
*The graph indicates the number of participants at risk at each time point and the number experiencing virologic failure in parenthesis.

