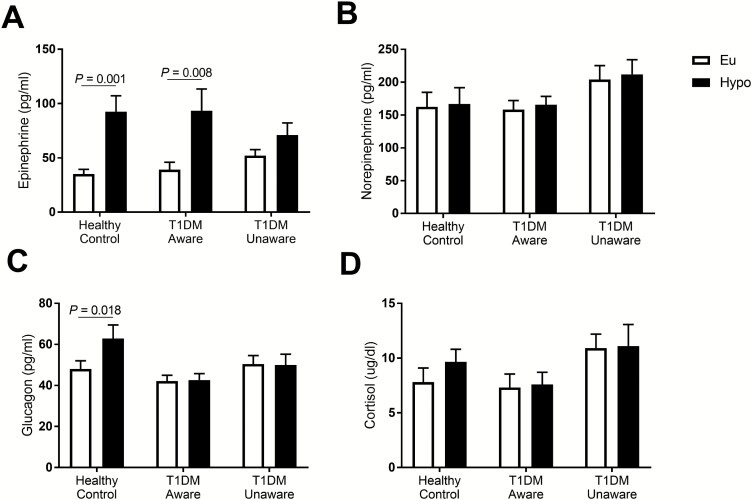
Figure 2.
Hormonal responses to mild hypoglycemia: (A) epinephrine, (B) norepinephrine, (C) glucagon, and (D) cortisol. Open bars denote euglycemia, black bars denote hypoglycemia. Euglycemia values were averaged from time 30 to 45 minutes of clamp. Hypoglycemia values were averaged from time 75 to 90 minutes of clamp. Data presented as mean±standard error of the mean, paired samples t test, *P < 0.05.

