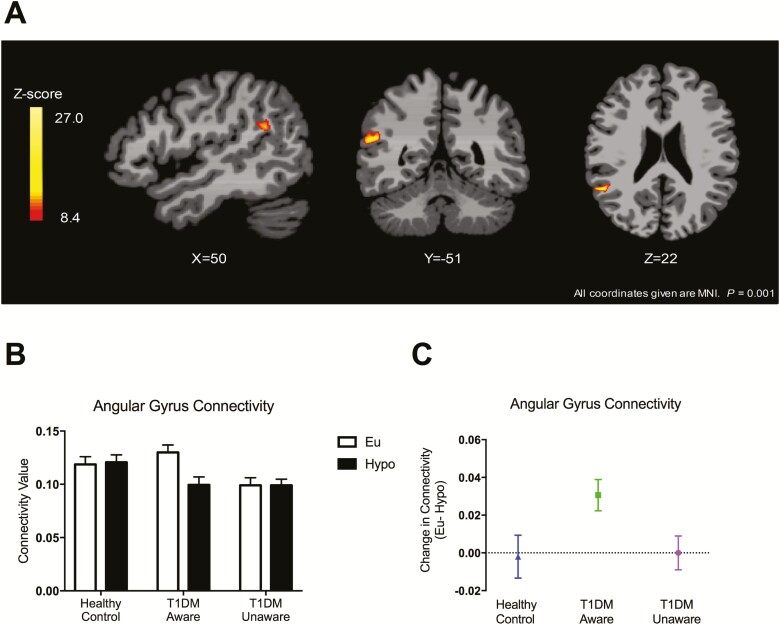
Figure 4.
Intrinsic connectivity distribution analysis: Group × Glycemia Effects. (A) Brain response to mild hypoglycemia compared to euglycemia across all three groups (covaried for age, body mass index, and plasma glucose levels); initial threshold of P < 0.001, 2-tailed, family-wise error whole brain corrected at P < 0.05). (B) Averaged connectivity values extracted from each participant (region of interest identified from significant cluster in right angular gyrus). Data expressed as mean ± standard error of the mean. (C) Change in connectivity values. Data expressed as mean ± 95% confidence interval.

