Figure 3.

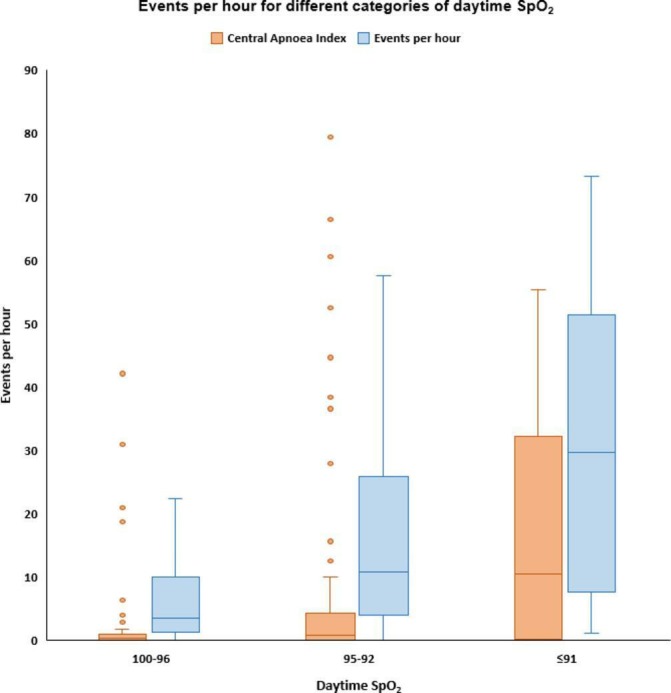
Apnoea-Hypopnoea Index and Central Apnoea Index for the different categories of daytime oxyhaemoglobin saturation (SpO2). Lower and upper boundaries of boxplot indicate 25th and 75th percentile.

Apnoea-Hypopnoea Index and Central Apnoea Index for the different categories of daytime oxyhaemoglobin saturation (SpO2). Lower and upper boundaries of boxplot indicate 25th and 75th percentile.