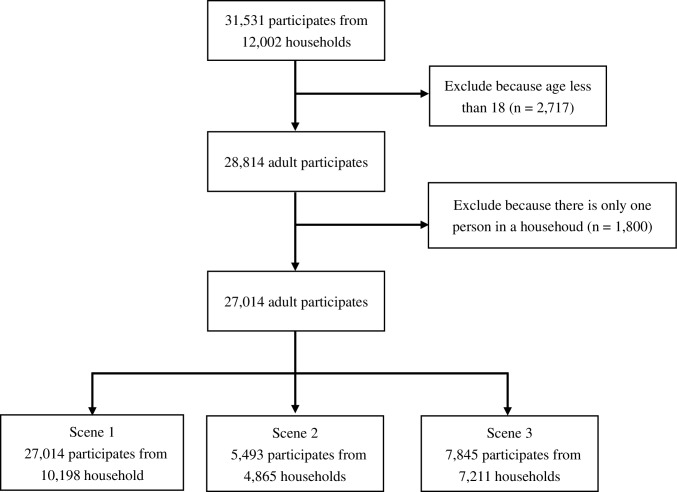
Figure 1.
The flow chart of participates selection of the three subsamples analysis. There were four participates missing in education status or marriage status in scene 1. There were four participates missing in education status or marriage status in scene 2. There was one participate missing in education status or marriage status in scene 3.

