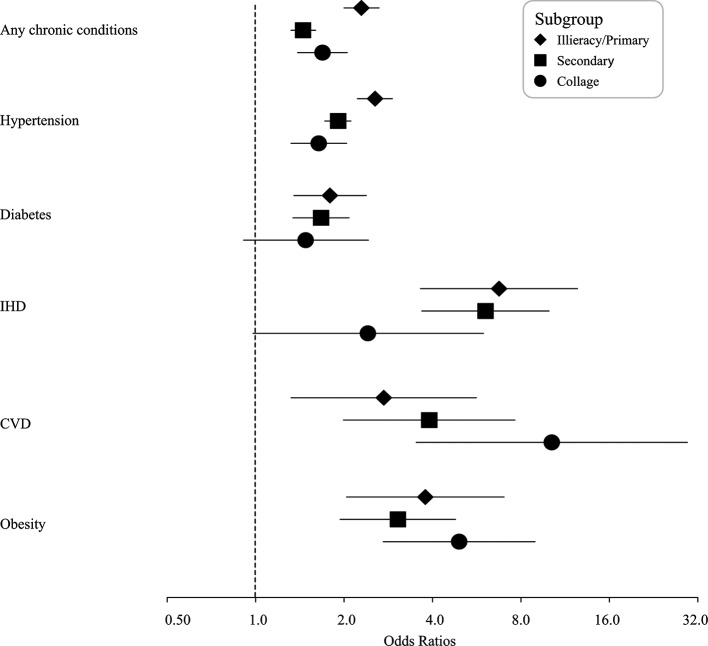
Figure 3.
The forest plot of five chronic conditions subgroup analysis categorised by education status. The plot showed the adjusted ORs and 95% CI of the association between each given chronic condition of individual with the same condition of household member. CVD, cerebrovascular disease; IHD, ischaemic heart disease.

