. 2020 Jan 3;17(1):35–40. doi: 10.21873/cgp.20165

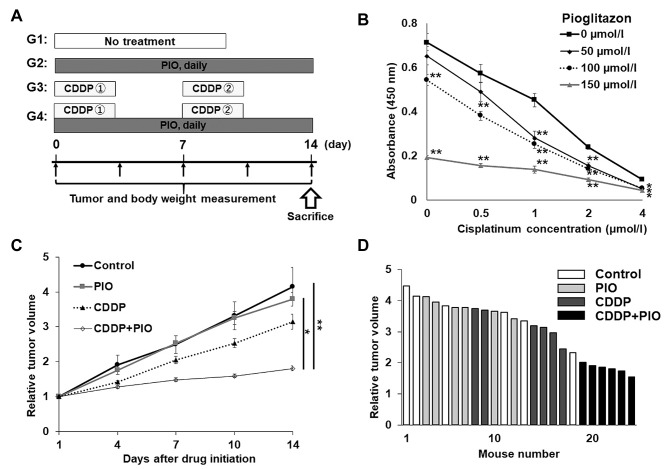
Figure 1. Treatment schema, cell viability of human osteosarcoma cells, and effect of drugs on the osteosarcoma-PDOX model. (A) Treatment protocol of the osteosarcoma-PDOX model. (B) Efficacy of CDDP and PIO on the viability of 143B cells. *p<0.05; **p<0.01. (C) Effect of drugs on the tumor volume of the osteosarcoma-PDOX model. Line graphs show tumor volume at each time point after the onset of treatment relative to the initial tumor volume for each treatment and control group. (D) Waterfall plot show relative tumor volume at day 14 compared to the initial tumor volume for each mouse. N=6 mice/group. *p<0.05; **p<0.01. Error bars: ±SEM.

Figure 1