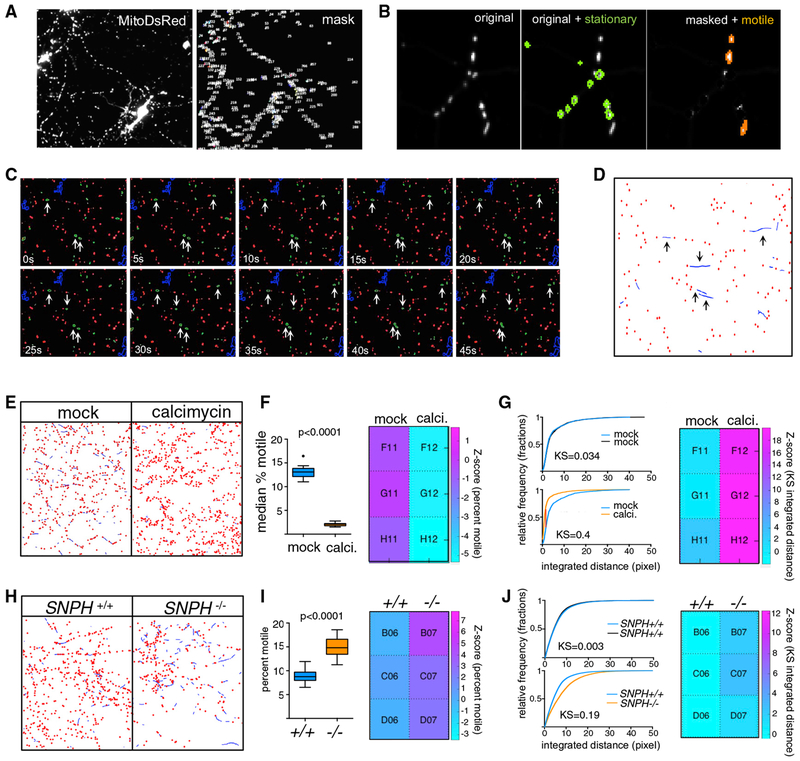
Figure 1. High-Content Assay to Screen for Regulators of Axonal Mitochondrial Trafficking.
(A) Rat hippocampal neurons transfected with Mito-DsRed to label mitochondria showing the original channel (left) and the masked channel (right) in which large objects such as somata and cell debris have been eliminated.
(B) Representative image of a portion of the time-lapse series where a mask based on minimum intensity projection is used to identify stationary (outlined in green) mitochondria. These mitochondria are subtracted from the image to facilitate tracking of the motile objects (orange).
(C) Time-lapse sequence of a small portion of an imaged field, with stationary (red) and motile (green) mitochondria identified based on the minimum intensity projection. Objects that exhibit significant movement are marked with an arrow.
(D) Results of tracking of mitochondria in the field shown in (C). A threshold for a minimum amount of movement has been applied to classify “wiggling” mitochondria as stationary, and the ”bona fide” motile mitochondria have been tracked using LAP algorithms (blue lines). Arrows indicated the tracks that represent the motile mitochondria identified in (C). See also Video S2.
(E). Graphic representation, as in (D), of mitochondrial tracks in neurons either treated with DMSO(mock) or 1 μM calcimycin. Calcimycin reduced movement (blue lines) and increased the number of stationary objects (red dots).
(F) Percent motile mitochondria as quantified by the CellProfiler pipeline, represented as Tukey’s box plot, and a heatmap of Z scores that was created using PATHS (see STAR Methods).
(G) Integrated distance of the tracked objects expressed as cumulative distribution plots to compare either two sets of DMSO-treated cultures (top) or DMSO versus calcimycin cultures (bottom). Heat maps are shown for KS values that compare the distributions of integrated distances. The displacement parameter was similarly altered by calcimycin (KS value ~0.3; Z score ~19).
(H, I, and J) Same analyses and representation as in (E), (F), and (G), respectively, but for a comparison between murine SNPH+/+ and SNPH−/− neurons. Two-tailed t test was used to obtain p values in (F) and (I) upon determination of normality on D’Agostino-Pearson test.

