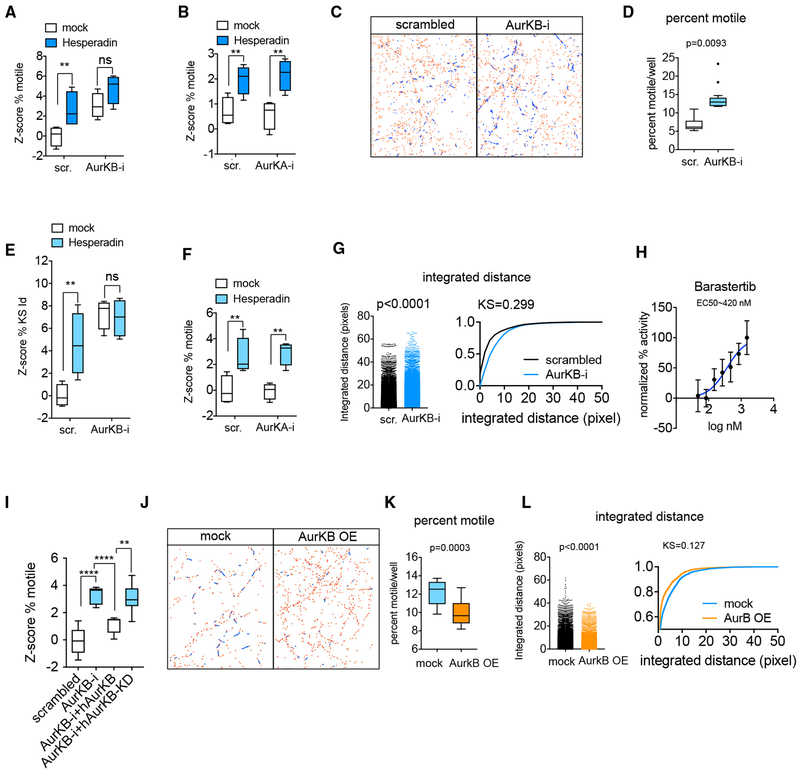
Figure 4. Aurora B is the Target of the Kinase Inhibitor Class of Hits.
(A) Z score of percent motile in neurons transfected with either scrambled or Aurora Kinase B shRNA and treated with 3 μM Hesperadin 1 h prior to and during time-lapse imaging.
(B) Z score of percent motile in neurons transfected with either scrambled or Aurora Kinase A shRNA and treated with 3 μM Hesperadin 1 h prior to and during time-lapse imaging.
(C) Representative image of mitochondrial traces in a field of neurons either transfected with scrambled shRNA or with Aurora Kinase B shRNA.
(D) Percent of motile mitochondria per well in neurons expressing either scrambled shRNA or shRNA against Aurora Kinase B.
(E and F) Z scores of KS-integrated distance of neurons treated as in (A) and (B), respectively.
(G) Integrated distance of mitochondrial traces in a representative well either transfected with scrambled shRNA or shRNA against Aurora Kinase B represented as a histogram and as a cumulative distribution. Each dot in the histogram corresponds to a single mitochondrial trajectory.
(H) Dose-response curve of the effect of Barastertib on percent motility; values were normalized to the maximum percentage motility at 2 μM Barastertib.
(I) Z score of percent motile of rat AurKB-i in combination with either wild-type (WT) or a kinase dead form of the RNAi-resistant human Aurora Kinase B.
(J) Representative images of mitochondrial traces in a field of neurons either transfected with empty plasmid or with a plasmid expressing rat Aurora Kinase B.
(K and L) Effect of Aurora Kinase B overexpression on percent motility (K) and integrated distance traveled (L).
At least 4 wells per condition (each well containing traces collected from over 10,000 mitochondria on average) were used for the calculation of Z scores. Statistical significance between groups of Z scores was determined using an unpaired two-tailed t test. ****p < 0.0001; ***p < 0.001; **p < 0.01; *p < 0.05; ns = p > 0.05. Data in (A), (B), (D)–(F), (I), and (K) represented as Tukey’s box plots. Data in (G) and (L) represented as dot-plots and cumulative distributions of integrated distance, and p values are given for Mann-Whitney test. Dispersion bars in (H) represent SD.

