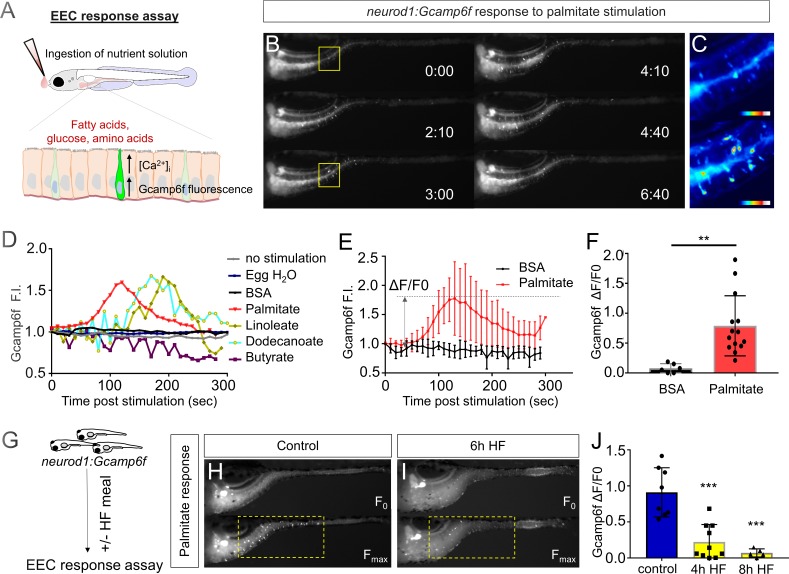
Figure 2. High fat feeding impairs the EEC calcium response toward palmitate stimulation.
(A) Measurement of the EEC response to nutrient stimulation using Tg(neurod1:Gcamp6f). (B) Time lapse image of the EEC response to BSA conjugated palmitate stimulation in Tg(neurod1:Gcamp6f) using the EEC response assay. Note that palmitate responsive EECs are primarily in the proximal intestine. (C) Heat map image indicating the EEC calcium response at 0 and 3 min post palmitate stimulation from the highlighted area in B. (D) Change in Gcamp6f relative fluorescence intensity in 5 min with no stimulation or stimulation with egg water, BSA vehicle, palmitate, linoleate, dodecanoate or butyrate. Note that only palmitate, linoleate and dodecanoate induced EEC calcium responses. (E, F) Change in Gcamp6f relative fluorescence intensity in BSA stimulated (n = 4) and palmitate stimulated animals (n = 5). (G) Measurement of EEC calcium responses to palmitate stimulation following 4–8 hr of high fat (HF) meal feeding in 6 dpf Tg(neurod1:Gcamp6f) larvae. (H, I) Representative images of the EEC response to palmitate stimulation in control larvae (without HF meal feeding, (H) and 6 hr of HF feeding (I). (J) Measurement of EEC calcium responses to palmitate stimulation in Tg(neurod1:Gcamp6f) larvae following 4 and 8 hr HF feeding. Student t-test was used in F and one-way ANOVA with post-hoc Tukey test was used in J. **p<0.01, ***p<0.001.


