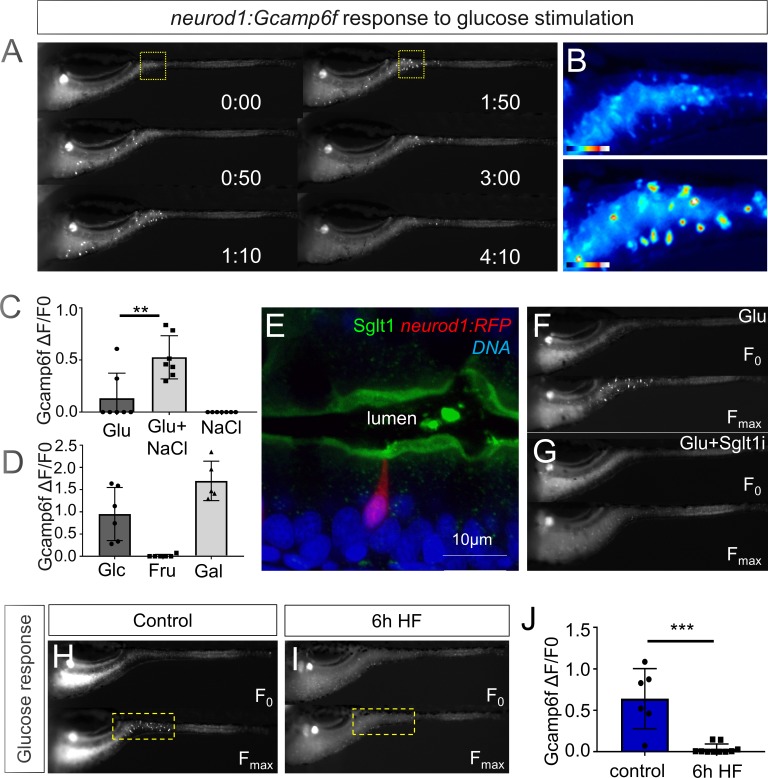
Figure 3. High fat feeding impairs EEC calcium response to glucose stimulation.
(A) Time lapse images of the EEC response to glucose (500 mM, dissolved in 100 mM NaCl solution) in 6 dpf Tg(neurod1:Gcamp6f) larvae using the EEC response assay. (B) Heat map image indicating the EEC calcium response at 0 and 1min 50s post glucose stimulation from the highlighted area in A. (C) Measurement of the EEC calcium response when stimulated with glucose (500 mM) dissolved in water or 100 mM NaCl vehicle. Note that the presence of NaCl significantly increased the glucose induced EEC calcium response. (D) Measurement of the EEC calcium response when stimulated with glucose (500 mM), fructose (500 mM) and galactose (500 mM). All of these stimulants were dissolved in 100 mM NaCl vehicle. Note that only glucose and galactose induced the EEC calcium response. (E) Confocal image of 6 dpf zebrafish intestine stained with Sglt1 antibody. EECs were marked by Tg(neurod1:RFP). Note that Sglt1 is located on the apical side of intestinal cells. (F, G) Representative image of the EEC calcium response in Tg(neurod1:Gcamp6f) when stimulated with 500 mM glucose or 500 mM glucose with a Sglt1 inhibitor (0.15 mM phloridzin). Note in G that when co-stimulated with glucose and Sglt1 inhibitor, the intestine appeared to dilate but no EEC activation was observed. (H,I) Representative image of the EEC calcium response to glucose stimulation in control larvae without high fat (HF) meal feeding (H) and 6 hr HF fed larvae (I). (J) Quantification of the EEC calcium response to glucose stimulation in control and 6 hr HF fed larvae. Student t-test was used in C,J. **p<0.01, ***p<0.001.


