. 2019 Dec 3;8:e48479. doi: 10.7554/eLife.48479

Figure 9. High fat feeding modifies microbiota composition.

(A) Colony forming unit (CFU) quantification in GF and CV dissected intestines with or without 6 hr of high fat (HF) feeding. (B) Experimental design of 16S rRNA gene sequencing in control larvae dissected gut and medium and 6 hr HF fed larvae dissected gut and medium. (C) Weighted UniFrac principal coordinates analysis (PCoA) of 16S rRNA gene sequences from control and HF fed gut and media samples The % variation explained by principal components (PC) 1 and 2 are shown on their respective axes. (D) Relative abundance of bacterial classes in control and HF fed gut and media. (E–F) Change in representative bacterial genera following HF feeding in gut and media. Asterisks indicate taxa with p<0.05 by LEfSe analysis. (G) Schematic of monoassociation screening to investigate the effects of specific bacterial strains on EEC morphology. Three dpf zebrafish larvae were colonized with one of the isolated bacterial strains and EEC morphology was scored after 8 hr high fat meal feeding in 6 dpf GF and monoassociated animals. (H) EEC morphology score of GF and monoassociated zebrafish larvae following 8 hr high fat feeding. Data were pooled from three independent experiments, with each dot representing an individual animal. The EEC morphology score in Acinetobacter sp. ZOR0008 monoassociated animals was significantly lower than GF EECs (p<0.001). No consistent significant differences were observed in other monoassociated groups. One way ANOVA followed by Tukey’s post-test was used in H for statistical analysis.

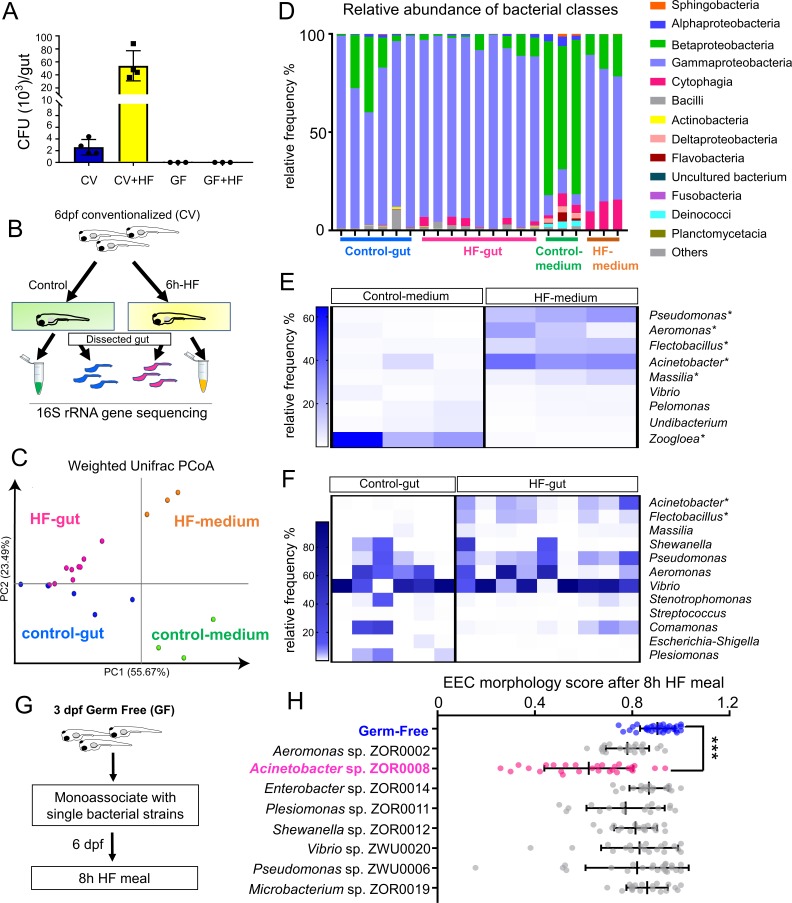
Figure 9.

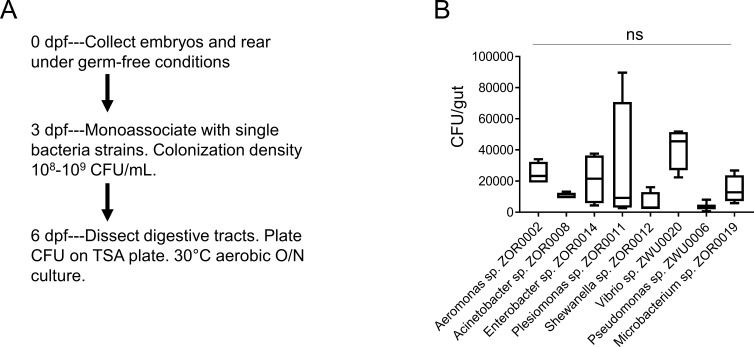
Figure 9—figure supplement 1. Colonization of bacterial strains during monoassociation.

Figure 9—figure supplement 1.

(A) Schematics of the experimental design. The digestive tracts from five zebrafish larvae were dissected and pooled, and CFU analysis was performed to assess the colonization efficiency for bacterial strains that were used for monoassociation. (B) CFU quantification of zebrafish larvae samples that were monoassociated with different bacterial strains. One-way ANOVA with post-hoc Tukey test was used in B for statistical analysis and no statistical differences among groups were observed (n = 4 for each group except for pseudomonas sp. ZWU0006 n = 3).
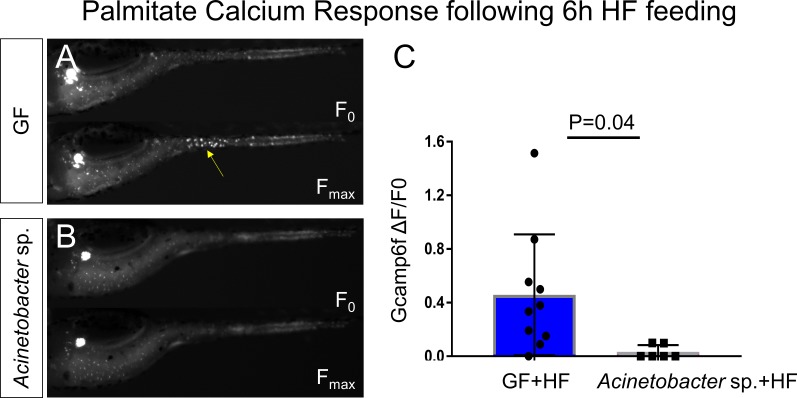
Figure 9—figure supplement 2. Acinetobacter sp. ZOR0008 monoassociated zebrafish EECs do not respond to palmitate stimulation after HF feeding.

Figure 9—figure supplement 2.

(A–B) Representative images of the EEC calcium response to palmitate stimulation in HF fed GF zebrafish (A) and HF fed Acinetobacter sp. monoassoicated zebrafish (B). (C) Quantification of EEC calcium response toward palmitate stimulation. Student t-test was used in C for statistical analysis.
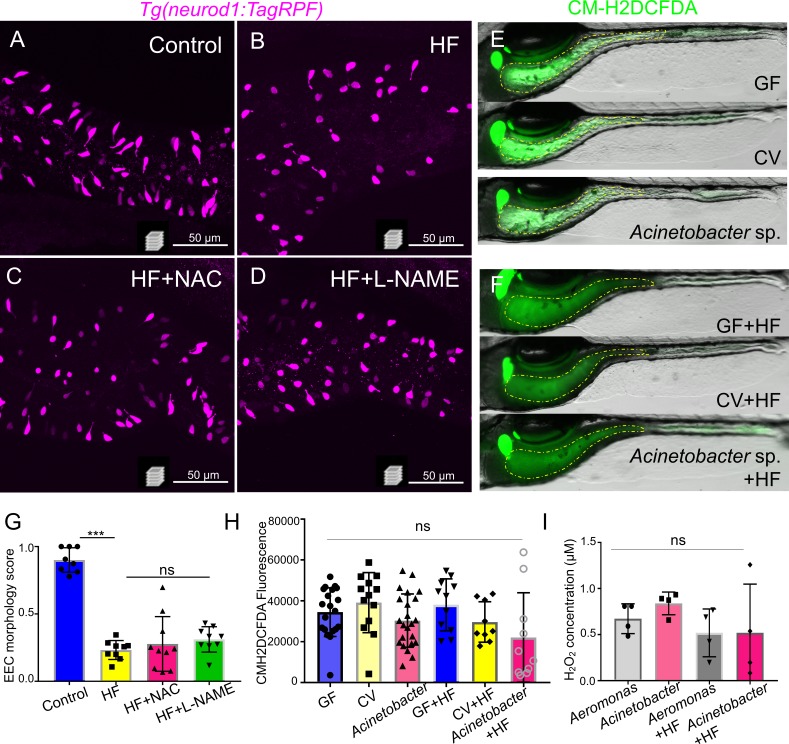
Figure 9—figure supplement 3. Inhibition of ROS signaling does not prevent HF feeding induced EEC silencing.

Figure 9—figure supplement 3.

(A–D) Representative confocal projection images of EECs (magenta) in Tg(neurod1:RFP) zebrafish under control conditions, HF feeding, HF feeding with the ROS inhibitor N-acetylcysteine (NAC), and HF feeding with the NOS inhibitor N(gamma)-nitro-L-arginine methyl ester (L-NAME). (E–F) Representative images of intestines in GF, CV and Acinetobacter sp. ZOR0008 monoassociated control or 6 hr HF fed zebrafish. The intestinal luminal ROS was labeled with CM-H2DCFDA. (G) Quantification of EEC morphology in control, HF fed, HF fed with NAC or L-NAME treated zebrafish. (H) Quantification of proximal intestinal lumenal CM-H2DCFDA fluoresence intensity in GF, CV and Acinetobacter sp. monoassociated control or 6 hr HF fed zebrafish. (I) In vitro measurement of the H2O2 concentration in 1010 CFU Aeromonas sp. ZOR0002 and Acinetobacter sp. ZOR0008 that were cultured in Trypticase Soy Broth or 5% egg yolk in water (HF).