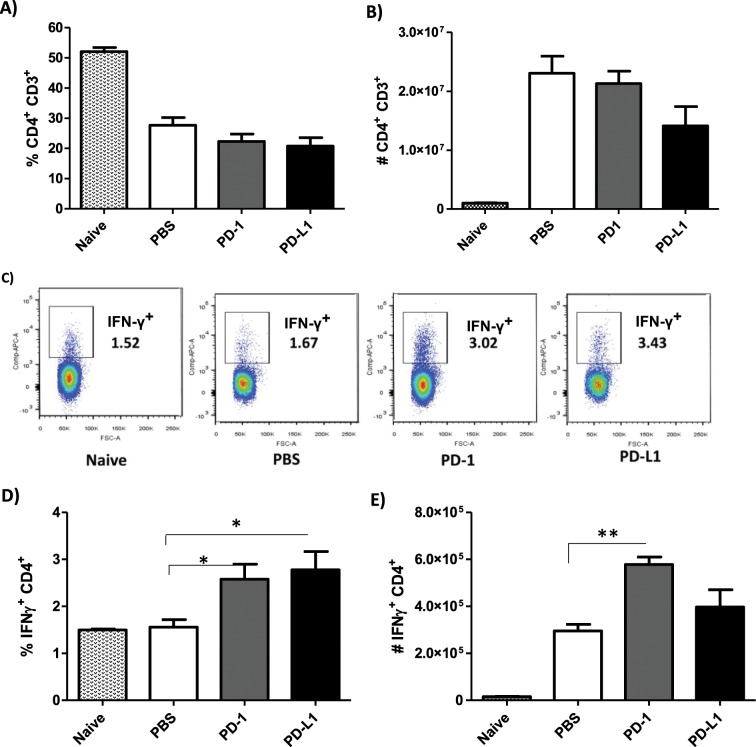
Figure 6.
Increase of IFN-γ+CD4+ T cells after anti-PD-1 and anti-PD-L1 MoAb treatment. Lymphocytes were collected from the popliteal lymph node of an L. amazonensis-infected paw after approximately 2 months of treatment with anti-PD-1 or anti-PD-L1, administered twice a week intraperitoneally beginning after 7 days of infection. (A) Percentage of CD3+CD4+ T cells. (B) Number of CD3+CD4+ T cells. (C) Dot plot of IFN-γ expression (APC-IFN-γ, FSC-cell volume). (D) Percentage of IFN-γ+CD4+ T cells. (E) Number of IFN-γ+ CD4+ T cells. (T Test (D) and ANOVA (E)). Naive = mice without infection and therapy, PBS = infected mice injected with PBS on treatment days, PD-1 = mice infected and treated with anti-PD-1 (100 μg/dose), PD-L1 = mice infected and treated with anti-PD-L1 (100 μg/dose). Data ± SEM of individually mice (5 mice/group) are representative of two independent experiments producing the same result profile. *p < 0.05, **p < 0.0375.

