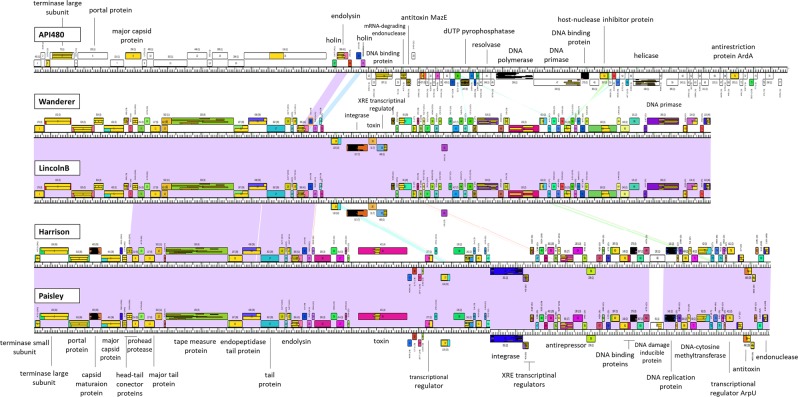
Figure 2.
Pairwise genome maps. API480 whole-genome was compared with the closest relatives, Wanderer, LincolnB, Harrison and Paisley. Maps were created with Phamerator. Pairwise sequence similarity (minimal BLASTN cut-off E-value is 10−5) is indicated according to colour spectrum where purple and red lines denote regions of highest and lowest nucleotide similarity, respectively. Gene products are labelled with predicted function (phams i.e. proteins members have the same colour, orphams i.e. unique proteins are shown in white). Their positioning either above or below the bar correspond to rightwards or leftwards transcription, respectively.

