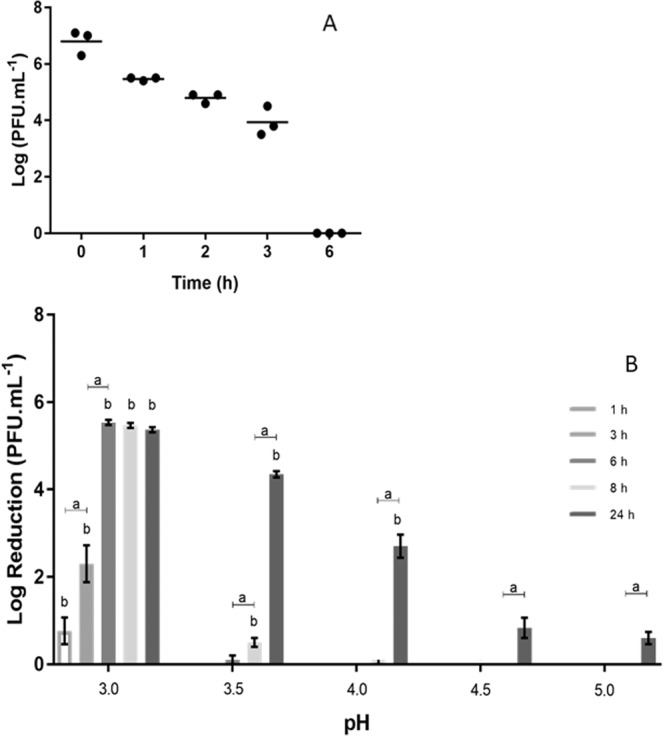
Figure 5.

(A) Effect of commercial RJ on the stability of API480 (PFU.mL−1). Data show each of three independent assays. Limit of detection (LOD) = 3 Log; Statistical significance, p < 0.05. (B) Effect of pH (from 3.0 to 5.0) in API480 phage concentration (PFU.mL−1). Each column represents the average of three independent assays and error bars indicate the standard deviation. LOD = 1 Log; Statistical significance, p < 0.05; “a” indicates differences for the same pH; for each timepoint, “b” indicates differences between data from a given pH and the subsequent pH value.
