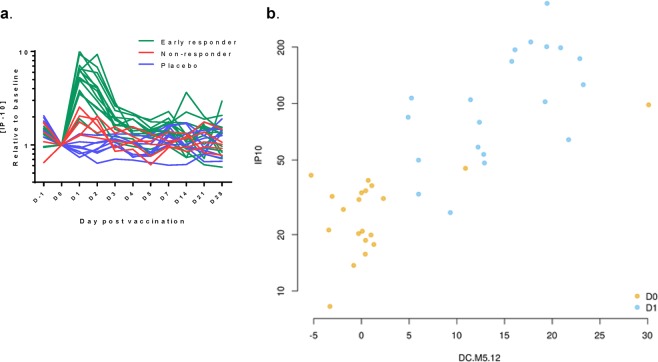
Figure 8.
Correlation between serum IP-10 levels and IFN-related gene activation. (a) ATIV recipients were stratified into ‘early responders’ or ‘non-responders’ with respect to the presence or absence of early (Day [D]1) enrichment in the IFN signatures. Serum IP-10 levels categorized by responder status are presented for the ATIV and placebo groups. (b) Eigengene plot showing the correlation between the eigengene of the ‘Interferon’ blood transcriptional module (BTM) DC.M5.1220 and the expression of IP-10 in the ATIV group at D0 and D1. Eigengene (as defined previously45) of a set of genes is calculated based on the expression of all genes in a gene set (BTM) and is correlated with the expression of the majority of the genes in the BTM. Pearson’s r = 0.81; p < 1e-6.

