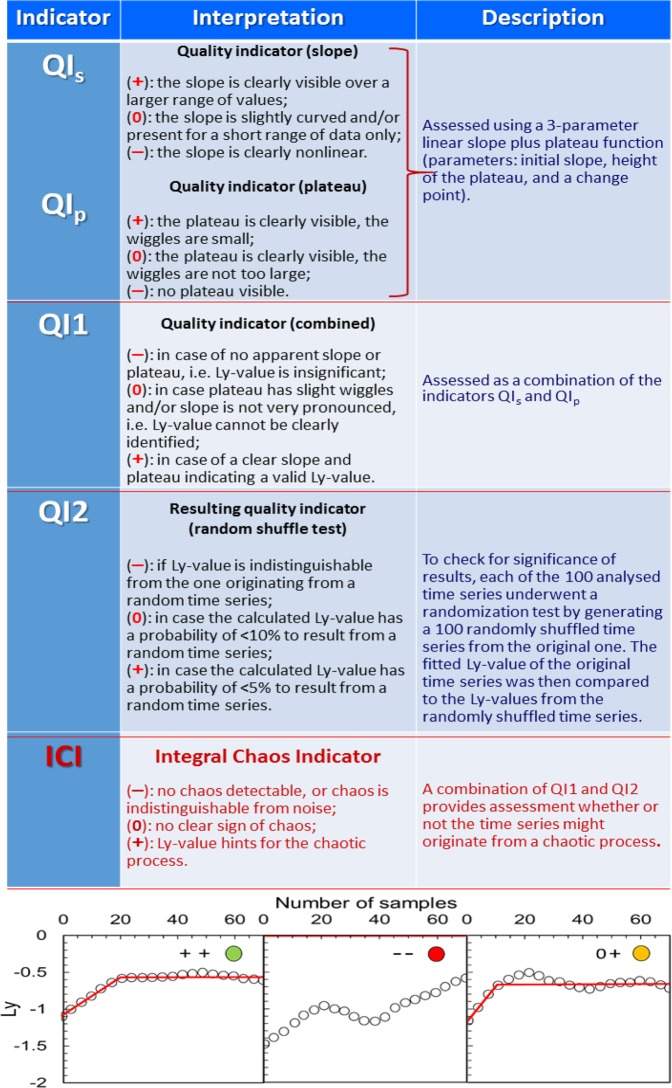
Figure 4.
Description of the quality Indicators QIs, QIp, QI1, QI2 and ICI, and visualization of assessment of the Lyapunov exponents using these indicators for the stationary window time series. Each graph in the lower panel shows the points calculated by Tisean v3.0.1 package (empty circles), a combined fit for the linear increase and plateau (red line), quality assessment (+, 0, −) by the indicators QI1 (first symbol) and QI2 (second symbol), and a large colour dot indicating the relevance (reliability) of the calculated Ly-values: green – positive test for both quality indicators (QI1 and QI2), yellow – positive test for just one of the indicators, red – negative tests for both indicators.

