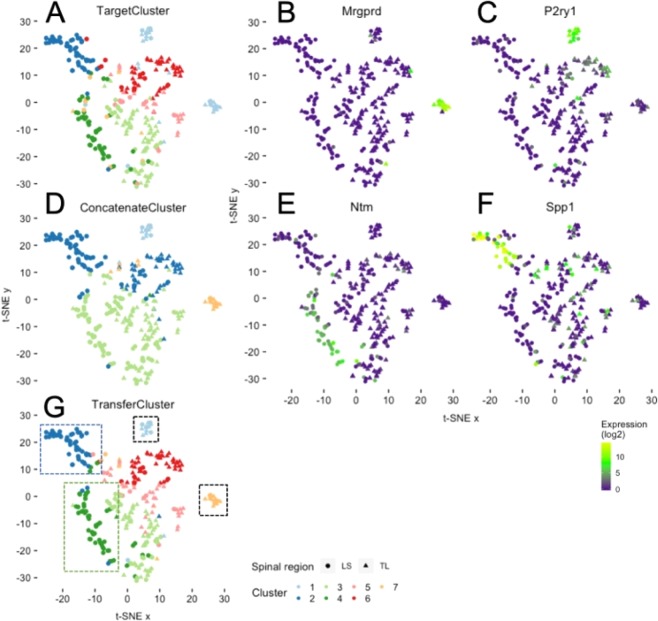
Figure 4.
Clustering example biological data using the transfer learning approach. t-SNE plots of mouse colonic sensory neurons: colour refers to clusters derived from the three approaches (A) TargetCluster, using only data from Hockley et al.21 to assign clusters. (D) ConcatenateCluster, using a concatenation of data from Hockley et al.21 and Usoskin et al.20 (mouse sensory neurons) to assign clusters. (G) TransferCluster, using the novel transfer learning approach with Usoskin et al.20 as Source and Hockley et al.21 as Target) and shape refers to spinal segment from which the neuron was isolated (triangle, TL (thoracolumbar); circle, LS (lumbosacral)). In G, clusters 1 and 7 (black dashed boxes), cluster 2 (blue dashed box) and cluster 4 (green dashed box) represent biologically distinct groups of cells with differing sensory functions. This is exemplified by the cluster-specific expression of specific genes by cluster 7 (B), Mrgprd), 1 (C, P2ry1), 2 (E, Ntm) and 4 (F, Spp1). Colour scheme represents expression level [log(TPM)].

